Jersey Shore: Fire Incidents, Pennsylvania (PA)
Where are fire incidents reported in Jersey Shore, PA
Something went wrong! Please refresh the page.
|
| |||||||||||||||||||||||||||||||||||||||||||||||||||||||||||||||||||||||||||||||||||||||||||||||||||||||||||||
| Other | 11 | |||||||||||||||||||||||||||||||||||||||||||||||||||||||||||||||||||||||||||||||||||||||||||||||||||||||||||||
2003 - 2018 National Fire Incident Reporting System (NFIRS) incidents
- Incident types reported to NFIRS in Jersey Shore, PA
- 45729.5%Fire
- 31020.0%Rescue & EMS
- 23615.2%Service Call
- 19612.7%Hazardous Condition
- 15910.3%False Alarm
- 1197.7%Good Intent Call
- 483.1%Special Incident
- 191.2%Severe Weather
- 40.3%Overpressure Rupture
- Fire incident types reported to NFIRS in Jersey Shore, PA
- 22348.8%Structure Fires
- 12226.7%Other
- 9119.9%Outside Fires
- 214.6%Mobile Property/Vehicle Fires
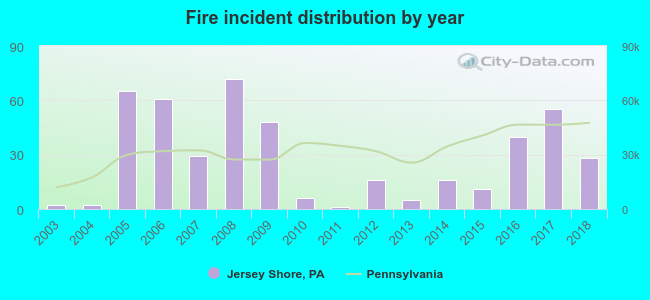 According to the data from the years 2003 - 2018 the average number of fire incidents per year is 29. The highest number of fire incidents - 72 took place in 2008, and the least - 1 in 2011. The data has an increasing trend.
 31.3% incidents where reported in the morning and 68.7% in the evening. The most fires (17.7%) took place on Friday, and the least (10.5%) on Tuesday.
 Based on the 457 fire incident reports from years 2003 - 2018 most fires (19.7%) took place during April, and the least (3.9%) in December.
 Out of all 1,548 cases reported during the years 2003 - 2018, the most belonged to the categories: Fire (29.5%), Rescue & EMS (20.0%), and Service Call (15.2%).
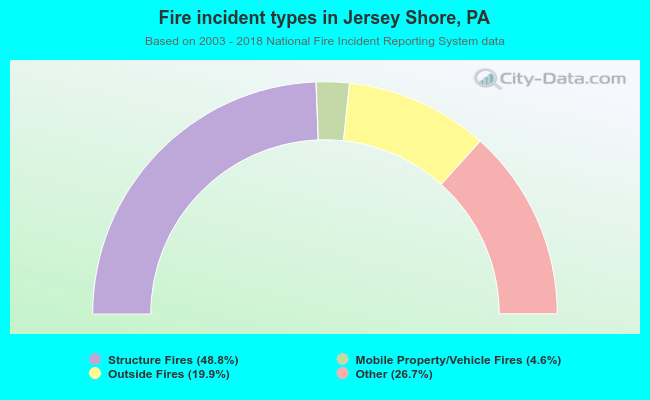 When looking into fire subcategories, the most reports belonged to: Structure Fires (48.8%), and Other (26.7%).