| Fire incidents reported |
|---|
| Sreet name | Count |
|---|
| 51ST ST | 58 | | 61ST ST | 44 | | HWY 51 | 14 | | CLUB 99 RD | 12 | | 433RD WEST AVE | 10 | | 51 HWY | 10 | | 61 ST | 10 | | 21ST ST | 8 | | 417TH WEST AVE | 8 | | 469TH WEST AVE | 8 | | 51 ST | 8 | | 36200 RD | 6 | | 417 W AVE | 6 | | 449TH WEST AVE | 6 | | 5800 RD | 6 | | 99 HWY | 6 | | HIGHWAY 51 | 6 | | 2MI N; 1/8MI E, NORTH INTO | 4 | | 401 E AVE | 4 | | 401 W AVE | 4 | | 41ST ST | 4 | | 449 W AVE | 4 | | 465TH WEST AVE | 4 | | 54173 WEST 1ST STREET | 4 | | 55176 SOUTH 360 ROAD | 4 |
| | | Fire incidents reported |
|---|
| Sreet name | Count |
|---|
| 55576 SOUTH 357 ROAD | 4 | | 5600 RD | 4 | | 56300 SOUTH 358 ROAD | 4 | | 5750 RD | 4 | | 5TH ST | 4 | | 61574 EAST 55 ROAD | 4 | | 63RD ST | 4 | | ARMSTRONG | 4 | | JENNINGS ROAD | 4 | | .5 EAST OF 21ST/99HWY 1 NORTH | 2 | | 1 MI E ON 99 CLUB ROAD | 2 | | 1 MI EAST ON 99 CLUB RD | 2 | | 1 MI N; 3/4 MI E, 1/2 MI N | 2 | | 1 MI NORTH, 1/4 MILE WEST | 2 | | 1 MI. E. 99 & 51 | 2 | | 1 MI. E. ON 99 CLUB RD | 2 | | 1 MI. E; 99 CLUB RD.;1/4 MI S | 2 | | 1 MI. EAST ON TERLTON ROAD | 2 | | 1 MI. EAST, 1 MI SOUTH | 2 | | 1 MI. N ; I MI E.; NORTH INTO | 2 | | 1 MI. N; 1-1/2 MI E; NORTH SID | 2 | | 1 MI. S OF JENNINGS | 2 | | 1 MI. S. ; EAST SIDE OF ROAD | 2 | | 1 MI. S; EAST SIDE OF ROAD | 2 | | |
|
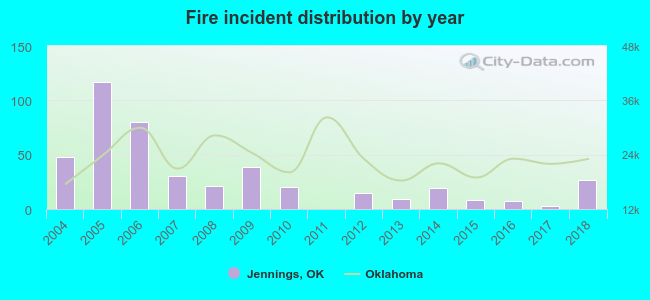 Based on the data from the years 2004 - 2018 the average number of fires per year is 30. The highest number of fire incidents - 117 took place in 2005, and the least - 0 in 2011. The data has a declining trend.
 21.4% incidents where reported in the morning and 78.6% in the evening. The most fires (18.5%) took place on Sunday, and the least (10.8%) on Thursday.
 According to the 443 fires from years 2004 - 2018 most fires (20.1%) took place during March, and the least (2.9%) in October.
 Out of all 617 cases reported during the years 2004 - 2018, the most belonged to the categories: Fire (71.8%), Overpressure Rupture (18.6%), and Service Call (5.7%).
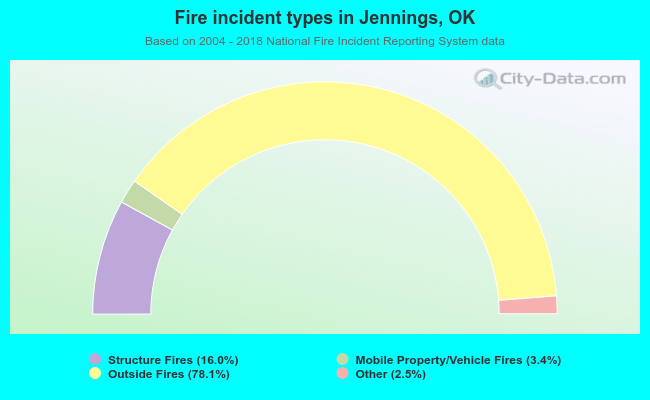 When looking into fire subcategories, the most incidents belonged to: Outside Fires (78.1%), and Structure Fires (16.0%).