Jackson: Fire Incidents, Louisiana (LA)
Where are fire incidents reported in Jackson, LA
Something went wrong! Please refresh the page.
|
| |||||||||||||||||||||||||||||||||||||||||||||||||||||||||||||||||||||||||||||||||||||||||||||||||||||||||||||
2002 - 2018 National Fire Incident Reporting System (NFIRS) incidents
- Incident types reported to NFIRS in Jackson, LA
- 78273.6%Rescue & EMS
- 17216.2%Fire
- 444.1%False Alarm
- 272.5%Good Intent Call
- 181.7%Service Call
- 141.3%Hazardous Condition
- 40.4%Severe Weather
- 20.2%Special Incident
- Fire incident types reported to NFIRS in Jackson, LA
- 7040.7%Structure Fires
- 5733.1%Outside Fires
- 3822.1%Mobile Property/Vehicle Fires
- 74.1%Other
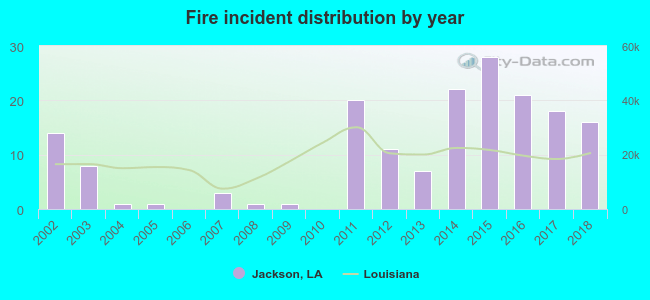 Based on the data from the years 2002 - 2018 the average number of fires per year is 10. The highest number of reported fires - 28 took place in 2015, and the least - 0 in 2006. The data has a rising trend.
 28.5% incidents where reported in the morning and 71.5% in the evening. The most fires (16.9%) took place on Thursday, and the least (12.8%) on Tuesday.
 According to the 172 fire incident reports from years 2002 - 2018 most fires (15.1%) took place during October, and the least (3.5%) in November.
 Out of all 1,063 cases reported during the years 2002 - 2018, the most belonged to the categories: Overpressure Rupture (73.6%), Fire (16.2%), and Good Intent Call (4.1%).
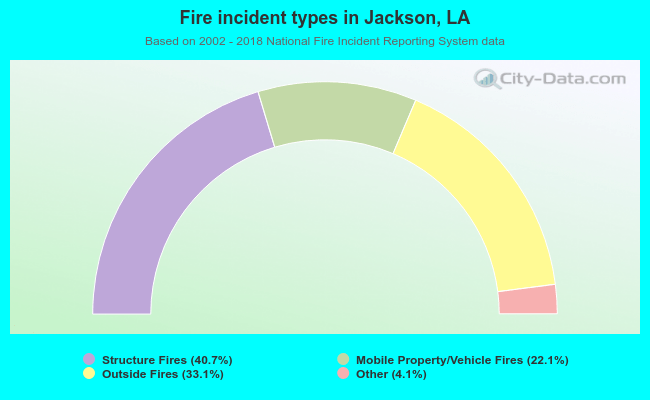 When looking into fire subcategories, the most reports belonged to: Structure Fires (40.7%), and Outside Fires (33.1%).