Ixonia: Fire Incidents, Wisconsin (WI)
Where are fire incidents reported in Ixonia, WI
Something went wrong! Please refresh the page.
|
| |||||||||||||||||||||||||||||||||||||||||||||||||||||||||||||||||||||||||||||||||||||||||||||||||||||||||||||
2002 - 2018 National Fire Incident Reporting System (NFIRS) incidents
- Incident types reported to NFIRS in Ixonia, WI
- 38048.3%Rescue & EMS
- 24230.7%Fire
- 546.9%Hazardous Condition
- 445.6%Good Intent Call
- 303.8%False Alarm
- 283.6%Service Call
- 81.0%Overpressure Rupture
- 10.1%Severe Weather
- Fire incident types reported to NFIRS in Ixonia, WI
- 12652.1%Structure Fires
- 8635.5%Outside Fires
- 208.3%Mobile Property/Vehicle Fires
- 104.1%Other
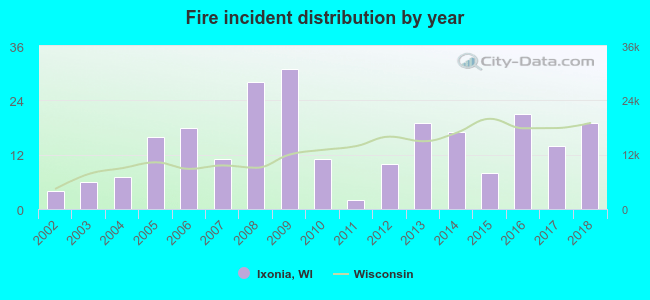 According to the data from the years 2002 - 2018 the average number of fires per year is 14. The highest number of reported fire incidents - 31 took place in 2009, and the least - 2 in 2011. The data has a rising trend.
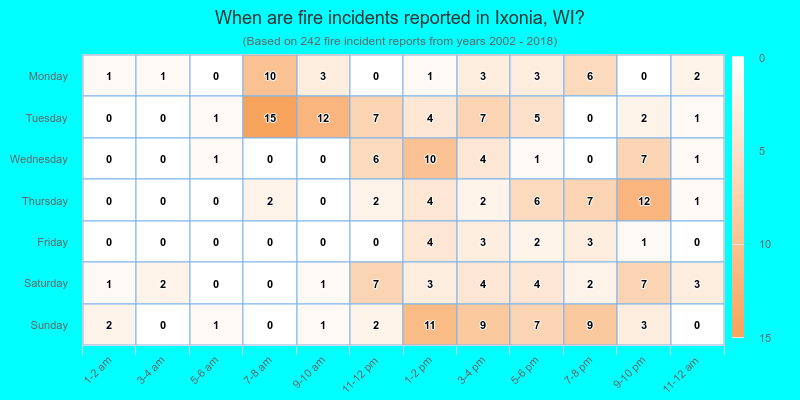
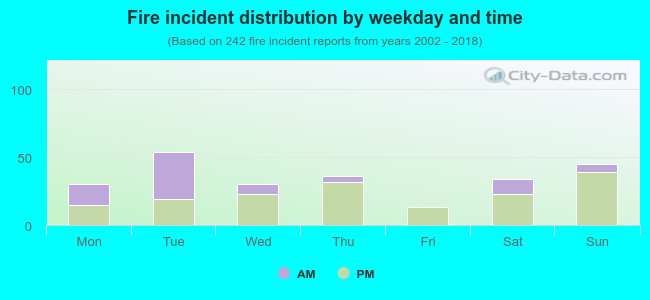 32.2% incidents where reported in the morning and 67.8% in the evening. The most fires (22.3%) took place on Tuesday, and the least (5.4%) on Friday.
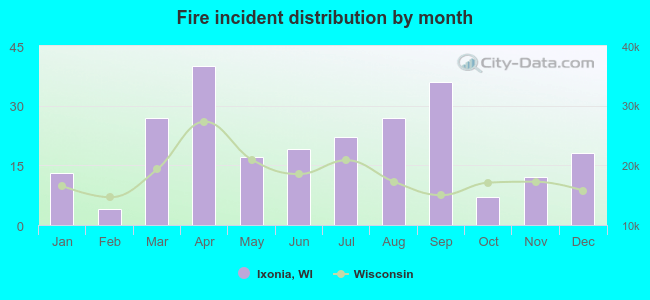 According to the 242 incident reports from years 2002 - 2018 most fires (16.5%) took place during April, and the least (1.7%) in February.
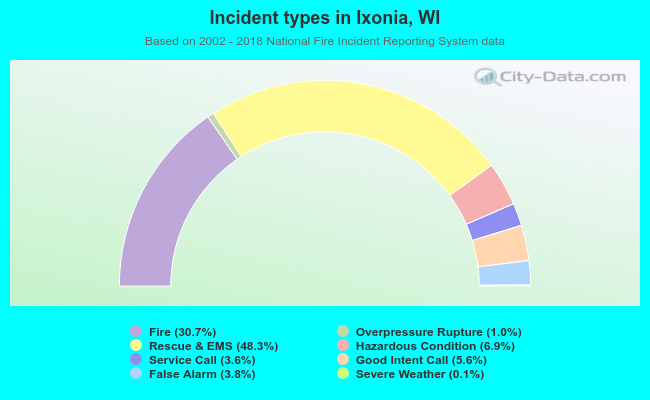 Out of all 787 cases reported during the years 2002 - 2018, the most belonged to the categories: Rescue & EMS (48.3%), Fire (30.7%), and Hazardous Condition (6.9%).
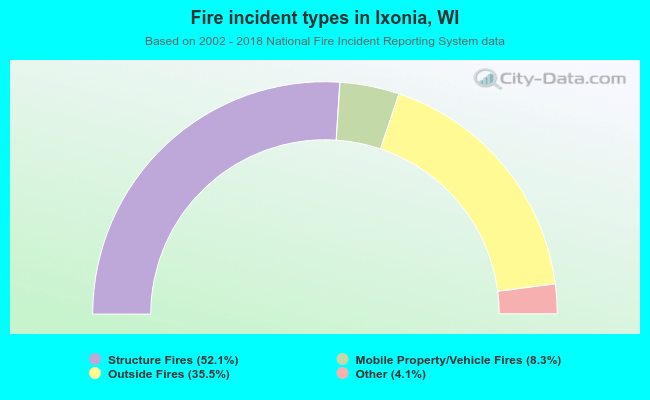 When looking into fire subcategories, the most incidents belonged to: Structure Fires (52.1%), and Outside Fires (35.5%).