Iuka: Fire Incidents, Illinois (IL)
Where are fire incidents reported in Iuka, IL
Something went wrong! Please refresh the page.
|
| |||||||||||||||||||||||||||||||||||||||||||||||||||||||||||||||||||||||||||||||||||||||||||||||||||||||||||||
2003 - 2018 National Fire Incident Reporting System (NFIRS) incidents
- Incident types reported to NFIRS in Iuka, IL
- 33354.7%Fire
- 19331.7%Rescue & EMS
- 315.1%Hazardous Condition
- 233.8%Good Intent Call
- 183.0%False Alarm
- 50.8%Service Call
- 30.5%Severe Weather
- 20.3%Special Incident
- 10.2%Overpressure Rupture
- Fire incident types reported to NFIRS in Iuka, IL
- 19558.6%Outside Fires
- 10732.1%Structure Fires
- 288.4%Mobile Property/Vehicle Fires
- 30.9%Other
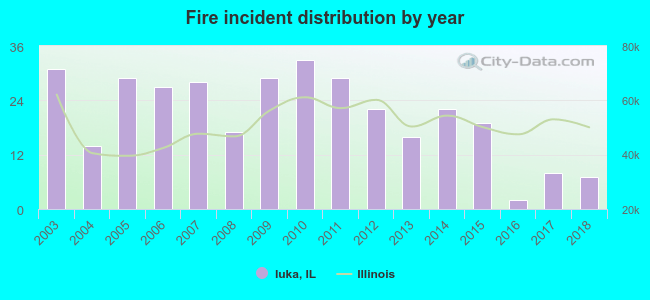 According to the data from the years 2003 - 2018 the average number of fire incidents per year is 21. The highest number of reported fire incidents - 33 took place in 2010, and the least - 2 in 2016. The data has a declining trend.
 21.0% incidents where reported in the morning and 79.0% in the evening. The most fires (20.1%) took place on Saturday, and the least (9.9%) on Monday.
 According to the 333 fire incident reports from years 2003 - 2018 most fires (15.3%) took place during March, and the least (3.9%) in September.
 Out of all 609 cases reported during the years 2003 - 2018, the most belonged to the categories: Fire (54.7%), Rescue & EMS (31.7%), and Hazardous Condition (5.1%).
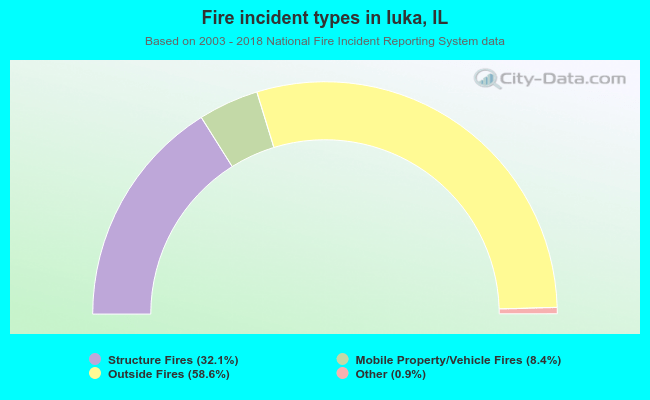 When looking into fire subcategories, the most incidents belonged to: Outside Fires (58.6%), and Structure Fires (32.1%).