Ithaca: Fire Incidents, Michigan (MI)
Where are fire incidents reported in Ithaca, MI
Something went wrong! Please refresh the page.
|
| |||||||||||||||||||||||||||||||||||||||||||||||||||||||||||||||||||||||||||||||||||||||||||||||||||||||||||||
2002 - 2018 National Fire Incident Reporting System (NFIRS) incidents
- Incident types reported to NFIRS in Ithaca, MI
- 52743.3%Fire
- 37330.6%Rescue & EMS
- 15412.6%Hazardous Condition
- 1129.2%Good Intent Call
- 282.3%Service Call
- 171.4%False Alarm
- 30.2%Severe Weather
- 30.2%Special Incident
- Fire incident types reported to NFIRS in Ithaca, MI
- 24546.5%Structure Fires
- 15930.2%Outside Fires
- 9417.8%Mobile Property/Vehicle Fires
- 295.5%Other
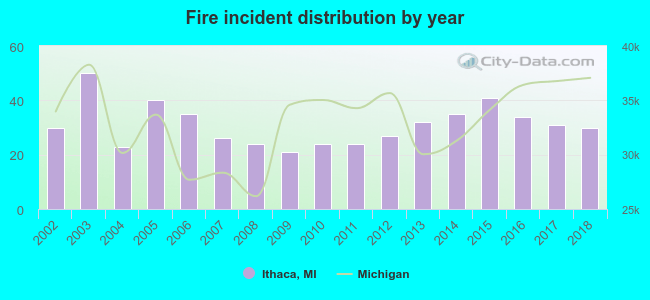 According to the data from the years 2002 - 2018 the average number of fires per year is 31. The highest number of fire incidents - 50 took place in 2003, and the least - 21 in 2009. The data has a constant trend.
 The median response time based on all reported fire incidents is 8 minutes. This is higher compared to the Michigan median value.
The median response time in Ithaca, MI compared to nearest cities:
(Note: Based on data for all years, including only cities with at least 500 fire incidents)
| Ithaca: | 8 minutes |
| Alma: | 7 minutes |
| Hemlock: | 12 minutes |
| Sheridan: | 9 minutes |
| Chesaning: | 10 minutes |
| Sanford: | 8 minutes |
| Midland: | 6 minutes |
| Owosso: | 6 minutes |
| Ionia: | 6 minutes |
 29.4% incidents where reported in the morning and 70.6% in the evening. The most fires (17.5%) took place on Sunday, and the least (11.4%) on Tuesday.
 According to the 527 fire incidents from years 2002 - 2018 most fires (15.0%) took place during April, and the least (5.7%) in June.
 Out of all 1,218 cases reported during the years 2002 - 2018, the most belonged to the categories: Fire (43.3%), Rescue & EMS (30.6%), and Hazardous Condition (12.6%).
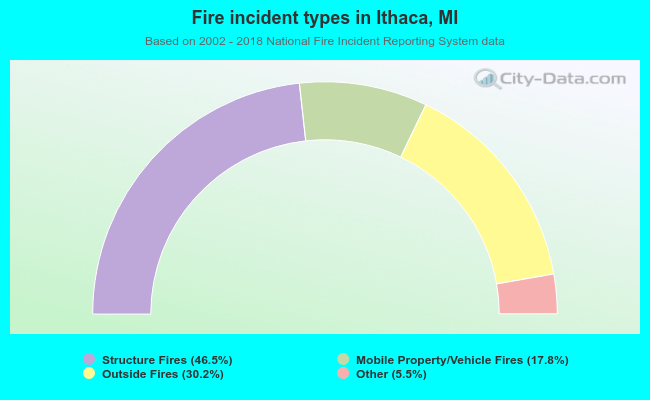 When looking into fire subcategories, the most incidents belonged to: Structure Fires (46.5%), and Outside Fires (30.2%).