Irwin: Fire Incidents, Pennsylvania (PA)
Where are fire incidents reported in Irwin, PA
Something went wrong! Please refresh the page.
|
| |||||||||||||||||||||||||||||||||||||||||||||||||||||||||||||||||||||||||||||||||||||||||||||||||||||||||||||
2003 - 2018 National Fire Incident Reporting System (NFIRS) incidents
- Incident types reported to NFIRS in Irwin, PA
- 75437.8%Fire
- 59029.6%Hazardous Condition
- 1829.1%Rescue & EMS
- 1778.9%False Alarm
- 1407.0%Good Intent Call
- 1286.4%Service Call
- 251.3%Severe Weather
- Fire incident types reported to NFIRS in Irwin, PA
- 39952.9%Structure Fires
- 15520.6%Other
- 12316.3%Outside Fires
- 7710.2%Mobile Property/Vehicle Fires
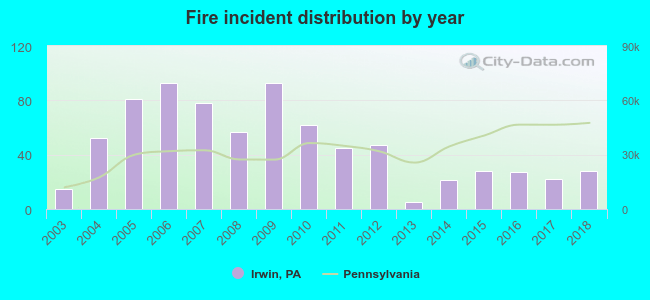 According to the data from the years 2003 - 2018 the average number of fire incidents per year is 47. The highest number of fires - 93 took place in 2006, and the least - 5 in 2013. The data has a growing trend.
 The median response time based on all reported fire incidents is 5 minutes. This is lower than the Pennsylvania median value.
The median response time in Irwin, PA compared to nearest cities:
(Note: Based on data for all years, including only cities with at least 500 fire incidents)
| Irwin: | 5 minutes |
| Jeannette: | 4 minutes |
| Murrysville: | 6 minutes |
| Export: | 2 minutes |
| McKeesport: | 5 minutes |
| Monroeville: | 6 minutes |
| Greensburg: | 4 minutes |
| Clairton: | 6 minutes |
| West Mifflin: | 7 minutes |
 30.8% incidents where reported in the morning and 69.2% in the evening. The most fires (16.3%) took place on Wednesday, and the least (11.8%) on Sunday.
 Based on the 754 reports from years 2003 - 2018 most fires (12.1%) took place during March, and the least (6.8%) in November.
 Out of all 1,996 cases reported during the years 2003 - 2018, the most belonged to the categories: Fire (37.8%), Rescue & EMS (29.6%), and Overpressure Rupture (9.1%).
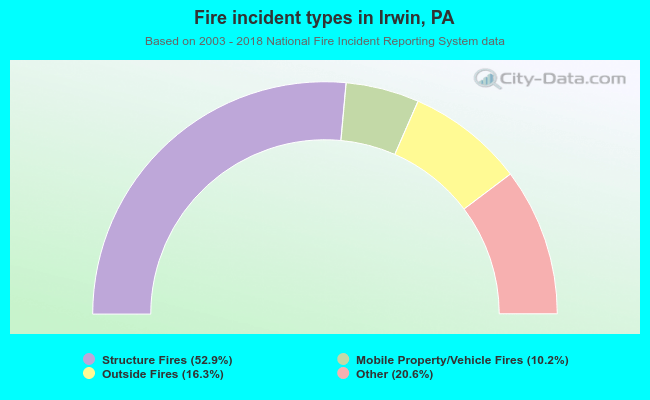 When looking into fire subcategories, the most reports belonged to: Structure Fires (52.9%), and Other (20.6%).