Iowa: Fire Incidents, Louisiana (LA)
Where are fire incidents reported in Iowa, LA
Something went wrong! Please refresh the page.
|
| |||||||||||||||||||||||||||||||||||||||||||||||||||||||||||||||||||||||||||||||||||||||||||||||||||||||||||||
2004 - 2018 National Fire Incident Reporting System (NFIRS) incidents
- Incident types reported to NFIRS in Iowa, LA
- 61439.3%Rescue & EMS
- 37524.0%Fire
- 24215.5%Hazardous Condition
- 1489.5%Service Call
- 1026.5%False Alarm
- 734.7%Good Intent Call
- 40.3%Overpressure Rupture
- 40.3%Severe Weather
- Fire incident types reported to NFIRS in Iowa, LA
- 16042.7%Outside Fires
- 11029.3%Structure Fires
- 6417.1%Mobile Property/Vehicle Fires
- 4110.9%Other
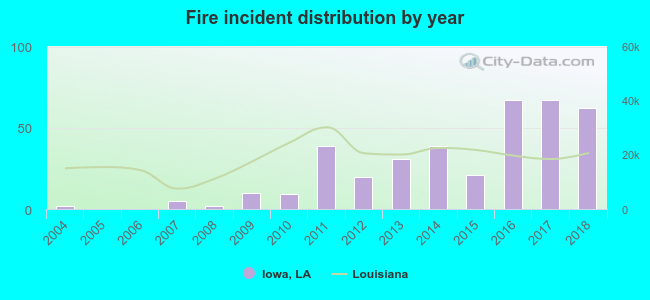 Based on the data from the years 2004 - 2018 the average number of fires per year is 25. The highest number of reported fires - 67 took place in 2016, and the least - 0 in 2005. The data has a rising trend.
 33.3% incidents where reported in the morning and 66.7% in the evening. The most fires (15.2%) took place on Wednesday, and the least (12.3%) on Tuesday.
 According to the 375 fire incident reports from years 2004 - 2018 most fires (14.1%) took place during November, and the least (5.9%) in September.
 Out of all 1,562 cases reported during the years 2004 - 2018, the most belonged to the categories: Rescue & EMS (39.3%), Fire (24.0%), and Hazardous Condition (15.5%).
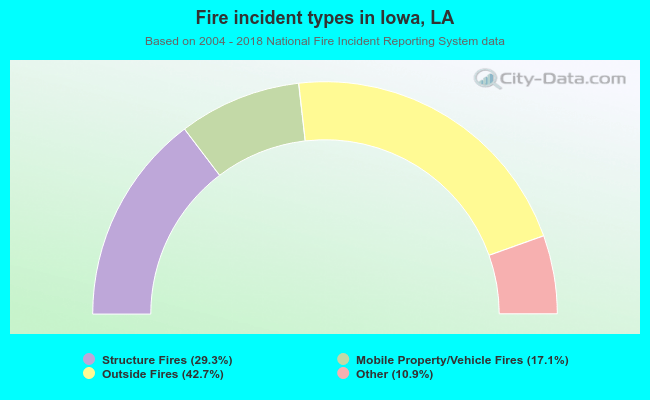 When looking into fire subcategories, the most reports belonged to: Outside Fires (42.7%), and Structure Fires (29.3%).