| Fire incidents reported |
|---|
| Sreet name | Count |
|---|
| OLD PHILADELPHIA PIKE | 26 | | OLD PHILADELPHIA PIKE | 24 | | CENTERVILLE RD | 16 | | NEWPORT RD | 16 | | NEWPORT RD | 14 | | CLEARVIEW RD | 10 | | CENTERVILLE RD | 8 | | CLEARVIEW RD | 6 | | NEW HOLLAND RD | 6 | | OSCEOLA MILL RD | 6 | | CENTERVILLE ROAD | 4 | | OSCEOLA MILL RD | 4 | | QUEEN RD | 4 | | QUEEN ROAD | 4 | | RAILROAD AVE | 4 | | BELMONT RD | 2 | | BLANK RD | 2 | | CAMBRIDGE ROAD | 2 | | CENTER STREET | 2 | | CENTERVILLE RD. | 2 | | COLONIAL RD | 2 | | COUNTRY LN | 2 | | DILLER STREET | 2 | | EAST NEWPORT ROAD | 2 | | FIELD CREST LN | 2 |
| | | Fire incidents reported |
|---|
| Sreet name | Count |
|---|
| FIELDCREST LA | 2 | | GORDON | 2 | | GROFFDALE RD | 2 | | HARVEST DRIVE | 2 | | HATVILLE RD | 2 | | HATVILLE RD | 2 | | HOLLANDER RD | 2 | | IRISHTOWN ROAD | 2 | | KINZER RD | 2 | | LIME QUARRY ROAD | 2 | | LINCOLN HWY EAST | 2 | | MAPLE STREET | 2 | | MILLWOOD ROAD | 2 | | NEWPORT AVE | 2 | | OLD LEACOCK ROAD | 2 | | OLD PHILA PIKE | 2 | | OLD PHILADELPHIA PK | 2 | | OLD PHILDELPHIA PK | 2 | | PAES RD | 2 | | PLEASANT AVE | 2 | | QUEEN RD | 2 | | RED WELL DR | 2 | | RIDGE ROAD | 2 | | SANDMINE ROAD | 2 | | |
|
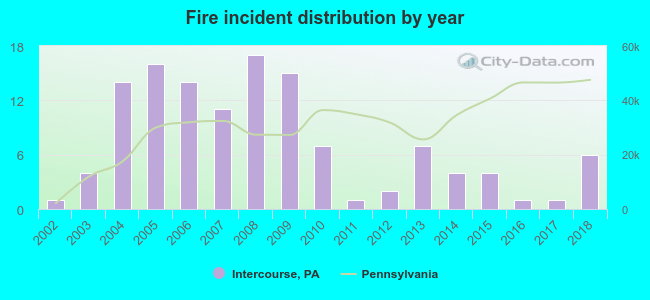 According to the data from the years 2002 - 2018 the average number of fire incidents per year is 7. The highest number of fires - 17 took place in 2008, and the least - 1 in 2002. The data has a growing trend.
 40.8% incidents where reported in the morning and 59.2% in the evening. The most fires (21.6%) took place on Saturday, and the least (8.8%) on Wednesday.
 According to the 125 reports from years 2002 - 2018 most fires (14.4%) took place during July, and the least (2.4%) in October.
 Out of all 172 cases reported during the years 2002 - 2018, the most belonged to the categories: Fire (72.7%), Hazardous Condition (8.1%), and Service Call (5.8%).
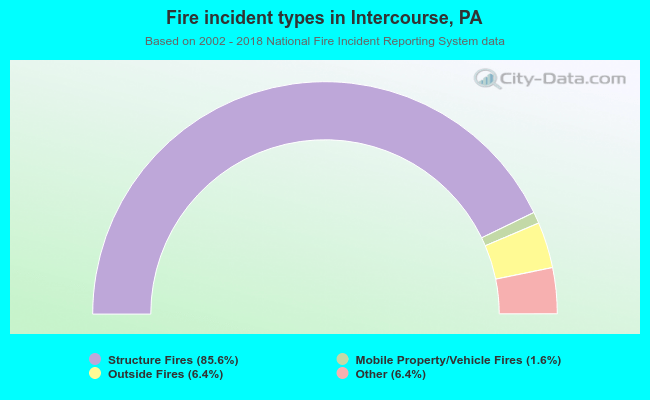 When looking into fire subcategories, the most incidents belonged to: Structure Fires (85.6%), and Outside Fires (6.4%).