Indian Shores: Fire Incidents, Florida (FL)
Where are fire incidents reported in Indian Shores, FL
Something went wrong! Please refresh the page.
| Fire incidents reported | |
|---|---|
| Sreet name | Count |
| GULF BLVD | 238 |
| 197 AVE | 4 |
| 175 E AVE | 2 |
| 186 AVE | 2 |
| 193 AVE | 2 |
| 8 ST | 2 |
| GULF | 2 |
| GULF BL-IS | 2 |
| LEE AVE | 2 |
| PARK BRIDGE BLVD | 2 |
| VISTA BAY DR | 2 |
2005 - 2018 National Fire Incident Reporting System (NFIRS) incidents
- Incident types reported to NFIRS in Indian Shores, FL
- 67947.4%Rescue & EMS
- 26118.2%False Alarm
- 19013.3%Good Intent Call
- 1309.1%Fire
- 1168.1%Hazardous Condition
- 453.1%Service Call
- 50.3%Severe Weather
- 30.2%Special Incident
- 20.1%Overpressure Rupture
- Fire incident types reported to NFIRS in Indian Shores, FL
- 7456.9%Structure Fires
- 3224.6%Outside Fires
- 1310.0%Other
- 118.5%Mobile Property/Vehicle Fires
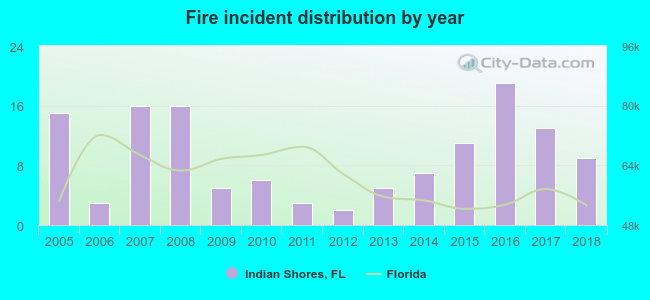 Based on the data from the years 2005 - 2018 the average number of fire incidents per year is 9. The highest number of reported fires - 19 took place in 2016, and the least - 2 in 2012. The data has a dropping trend.
 Based on the reports from the years 2005 - 2018 the average number of fire-related casualties per year is 0. The highest number of casualties - 3 took place in 2016, and the lowest - 0 in 2005. The data has a constant trend.
 32.3% incidents where reported in the morning and 67.7% in the evening. The most fires (19.2%) took place on Friday, and the least (10.8%) on Wednesday.
 Based on the 130 fire incidents from years 2005 - 2018 most fires (13.8%) took place during September, and the least (2.3%) in August.
 Out of all 1,431 cases reported during the years 2005 - 2018, the most belonged to the categories: Rescue & EMS (47.4%), False Alarm (18.2%), and Good Intent Call (13.3%).
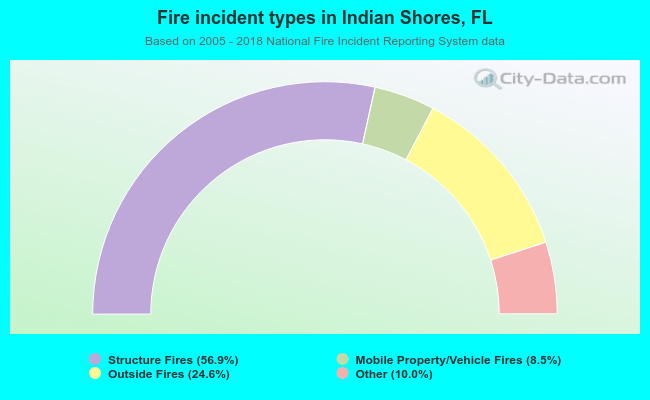 When looking into fire subcategories, the most incidents belonged to: Structure Fires (56.9%), and Outside Fires (24.6%).