Indian Head: Fire Incidents, Maryland (MD)
Where are fire incidents reported in Indian Head, MD
Something went wrong! Please refresh the page.
| Fire incidents reported | |
|---|---|
| Sreet name | Count |
| INDIAN HEAD HWY | 252 |
| STRAUSS AVE | 134 |
| HAWTHORNE RD | 106 |
| CHICAMUXEN RD | 68 |
| LIVINGSTON RD | 58 |
| BLAIR RD | 48 |
| CIRCLE AVE | 46 |
| INDIAN HEAD AVE | 46 |
| GLYMONT RD | 38 |
| RIVERSIDE RUN DR | 38 |
| STRAUSS AVENUE | 36 |
| GREENWOOD PL | 34 |
| BICKNELL RD | 30 |
| JAMESON CT | 30 |
| NOS | 30 |
| SMALLWOOD CHURCH RD | 30 |
| INDIAN HEAD HIGHWAY | 28 |
| INDIAN HEAD HWY | 28 |
| MASON SPRINGS RD | 28 |
| CHAPMANS LANDING RD | 26 |
| RIVERS EDGE PL | 24 |
| WOODLAND DR | 24 |
| MATTAWOMAN CT | 22 |
| MATTINGLY AVE | 22 |
| PG COUNTY | 22 |
| FAIRHILL LN | 20 |
| HAWTHORNE ROAD | 20 |
| POPLAR LN | 20 |
| REVELS PL | 20 |
| HIGH GROUND FARM PL | 18 |
| Other | 443 |
2002 - 2018 National Fire Incident Reporting System (NFIRS) incidents
- Incident types reported to NFIRS in Indian Head, MD
- 1,78928.8%Fire
- 1,45623.4%Good Intent Call
- 1,15518.6%Rescue & EMS
- 1,11017.8%Hazardous Condition
- 3766.0%Service Call
- 1863.0%False Alarm
- 1352.2%Severe Weather
- 90.1%Overpressure Rupture
- Fire incident types reported to NFIRS in Indian Head, MD
- 1,21567.9%Structure Fires
- 43324.2%Outside Fires
- 895.0%Mobile Property/Vehicle Fires
- 522.9%Other
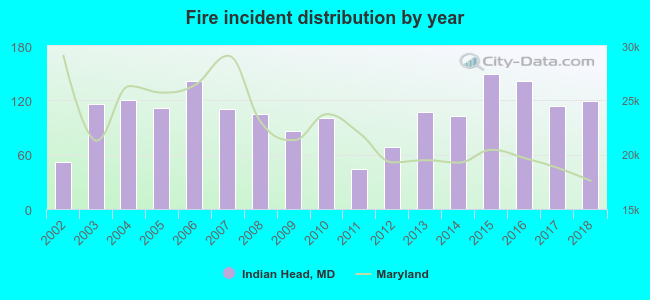 According to the data from the years 2002 - 2018 the average number of fires per year is 105. The highest number of fire incidents - 149 took place in 2015, and the least - 44 in 2011. The data has a growing trend.
 The median response time based on all reported fire incidents is 6 minutes. This is close to the state median value.
The median response time in Indian Head, MD compared to nearest cities:
(Note: Based on data for all years, including only cities with at least 500 fire incidents)
| Indian Head: | 6 minutes |
| Bryans Road: | 6 minutes |
| Accokeek: | 9 minutes |
| La Plata: | 7 minutes |
| Fort Washington: | 8 minutes |
| Waldorf: | 6 minutes |
| Oxon Hill: | 7 minutes |
| Brandywine: | 10 minutes |
| Clinton: | 7 minutes |
 31.9% incidents where reported in the morning and 68.1% in the evening. The most fires (16.3%) took place on Monday, and the least (11.1%) on Sunday.
 According to the 1,789 incident reports from years 2002 - 2018 most fires (11.9%) took place during March, and the least (4.5%) in September.
 Out of all 6,219 cases reported during the years 2002 - 2018, the most belonged to the categories: Fire (28.8%), Good Intent Call (23.4%), and Rescue & EMS (18.6%).
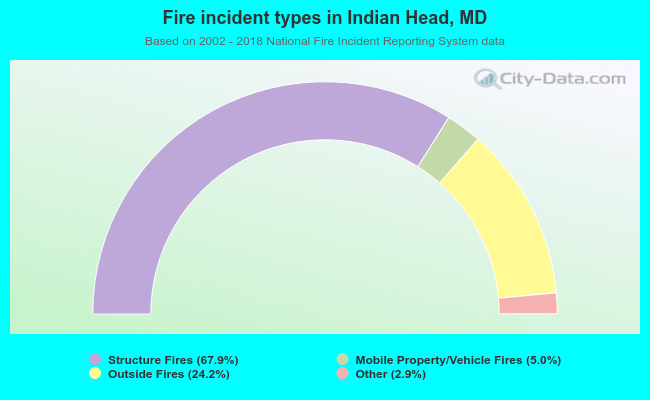 When looking into fire subcategories, the most incidents belonged to: Structure Fires (67.9%), and Outside Fires (24.2%).