Indialantic: Fire Incidents, Florida (FL)
Where are fire incidents reported in Indialantic, FL
Something went wrong! Please refresh the page.
|
| |||||||||||||||||||||||||||||||||||||||||||||||||||||||||||||||||||||||||||||||||||||||||||||||||||||||||||||
2003 - 2018 National Fire Incident Reporting System (NFIRS) incidents
- Incident types reported to NFIRS in Indialantic, FL
- 4,34555.1%Rescue & EMS
- 1,19015.1%Special Incident
- 5817.4%Hazardous Condition
- 5456.9%Good Intent Call
- 5096.5%Service Call
- 4015.1%Fire
- 3093.9%False Alarm
- Fire incident types reported to NFIRS in Indialantic, FL
- 19648.9%Outside Fires
- 11027.4%Structure Fires
- 5012.5%Other
- 4511.2%Mobile Property/Vehicle Fires
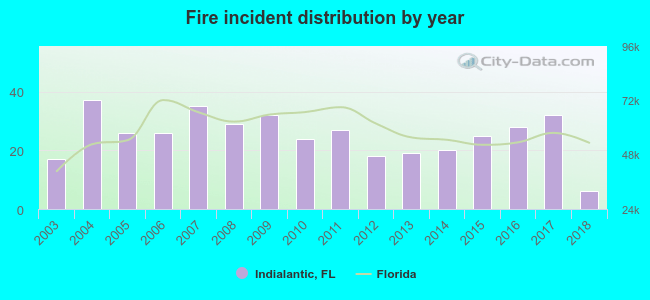 Based on the data from the years 2003 - 2018 the average number of fire incidents per year is 25. The highest number of reported fires - 37 took place in 2004, and the least - 6 in 2018. The data has a dropping trend.
 29.7% incidents where reported in the morning and 70.3% in the evening. The most fires (16.2%) took place on Sunday, and the least (11.5%) on Thursday.
 Based on the 401 reports from years 2003 - 2018 most fires (13.0%) took place during April, and the least (4.5%) in September.
 Out of all 7,886 cases reported during the years 2003 - 2018, the most belonged to the categories: Rescue & EMS (55.1%), Special Incident (15.1%), and Hazardous Condition (7.4%).
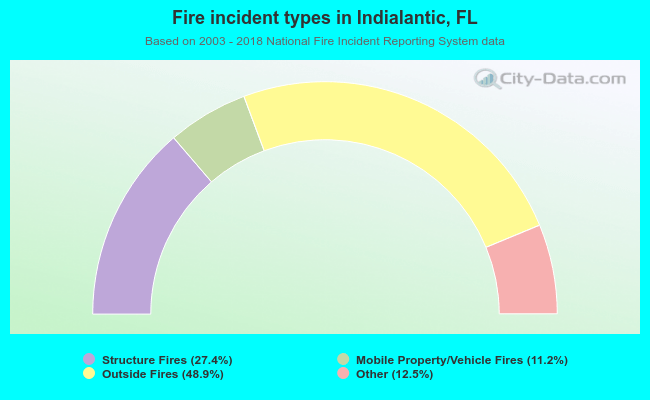 When looking into fire subcategories, the most incidents belonged to: Outside Fires (48.9%), and Structure Fires (27.4%).