| Fire incidents reported |
|---|
| Sreet name | Count |
|---|
| INDIAHOMA RD | 14 | | CACHE RD | 8 | | MAIN ST | 8 | | NW INDIAHOMA RD | 8 | | POST OAK RD | 8 | | US 62 | 8 | | US 62 HWY | 8 | | 206 INDIAHOMA RD | 6 | | BIG BOW RD | 6 | | BISHOP RD | 6 | | GORE BLVD | 6 | | 257/CROSS | 4 | | 257TH | 4 | | 405 WHEATLAND | 4 | | BANDY RD | 4 | | CROSS RD | 4 | | HAMPSHIRE AVE | 4 | | HWY 62 / INDIAHOMA RD | 4 | | INDIAHOMA | 4 | | NW ROGERS LANE | 4 | | TINNEY RD | 4 | | 1 TIMBERLANE LANE | 2 | | 1/2 MILE SOUTH OF BASELINE | 2 | | 1004 NW 287TH | 2 | | 102 CHEBATAH | 2 |
| | | Fire incidents reported |
|---|
| Sreet name | Count |
|---|
| 1107 SW INDIAHOMA RD | 2 | | 1111 INDIAHOMA RD. | 2 | | 1111 NW INDIAHOMA RD | 2 | | 1151 NW BIG BOW ROAD | 2 | | 1257 NW BANDY RD | 2 | | 168 NW HOLSEY ACRES LANE | 2 | | 1845 NW 267 | 2 | | 19 | 2 | | 197TH & GORE | 2 | | 19900 W. GORE | 2 | | 200 NW 267 | 2 | | 201 ASENAP STREET | 2 | | 202 SHOWPLACE | 2 | | 204 ASENAP | 2 | | 204 ASENAP ST | 2 | | 210 ASENAP | 2 | | 212 MAIN | 2 | | 21217 W GORE | 2 | | 21343 W GORE BLVD | 2 | | 21377 W GORE | 2 | | 214 POTTER ST. | 2 | | 21466 SW PECAN RD | 2 | | 21610 W BORE BLVD | 2 | | 21610 W GORE BLVD | 2 | | |
|
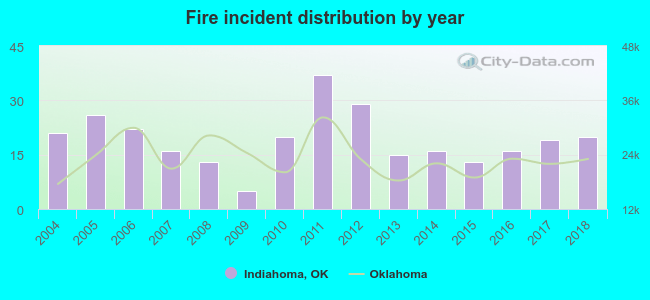 Based on the data from the years 2004 - 2018 the average number of fires per year is 19. The highest number of fire incidents - 37 took place in 2011, and the least - 5 in 2009. The data has a declining trend.
 27.4% incidents where reported in the morning and 72.6% in the evening. The most fires (17.4%) took place on Thursday, and the least (9.4%) on Sunday.
 According to the 288 fires from years 2004 - 2018 most fires (18.4%) took place during July, and the least (3.1%) in October.
 Out of all 690 cases reported during the years 2004 - 2018, the most belonged to the categories: Fire (41.7%), Rescue & EMS (39.1%), and Good Intent Call (11.0%).
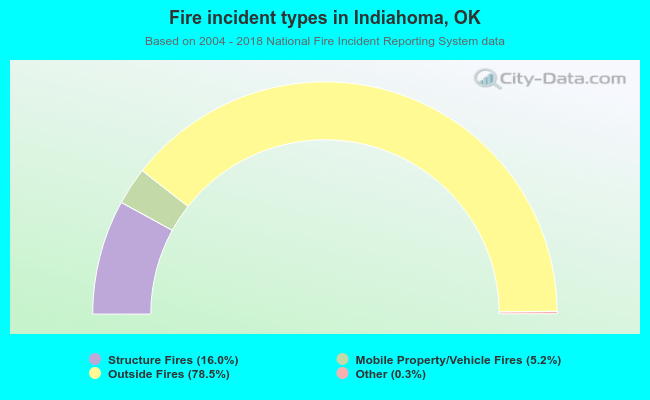 When looking into fire subcategories, the most incidents belonged to: Outside Fires (78.5%), and Structure Fires (16.0%).