Ina: Fire Incidents, Illinois (IL)
Where are fire incidents reported in Ina, IL
Something went wrong! Please refresh the page.
|
| |||||||||||||||||||||||||||||||||||||||||||||||||||||||||||||||||||||||||||||||||||||||||||||||||||||||||||||
2003 - 2018 National Fire Incident Reporting System (NFIRS) incidents
- Incident types reported to NFIRS in Ina, IL
- 35860.7%Rescue & EMS
- 12220.7%Fire
- 6711.4%Good Intent Call
- 315.3%Hazardous Condition
- 81.4%False Alarm
- 40.7%Service Call
- Fire incident types reported to NFIRS in Ina, IL
- 5645.9%Outside Fires
- 3327.0%Structure Fires
- 3226.2%Mobile Property/Vehicle Fires
- 10.8%Other
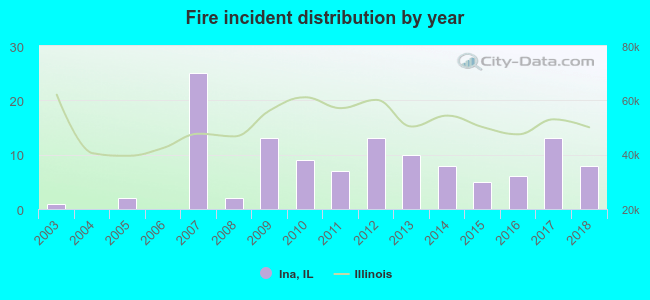 According to the data from the years 2003 - 2018 the average number of fire incidents per year is 8. The highest number of fire incidents - 25 took place in 2007, and the least - 0 in 2004. The data has a rising trend.
 According to the reports from the years 2003 - 2018 the average number of fire-related yearly casualties is 0. The highest number of injuries - 3 took place in 2017, and the lowest - 0 in 2003. The data has a constant trend.
 27.9% incidents where reported in the morning and 72.1% in the evening. The most fires (20.5%) took place on Monday, and the least (10.7%) on Thursday.
 According to the 122 reports from years 2003 - 2018 most fires (15.6%) took place during August, and the least (2.5%) in January.
 Out of all 590 cases reported during the years 2003 - 2018, the most belonged to the categories: Overpressure Rupture (60.7%), Fire (20.7%), and Service Call (11.4%).
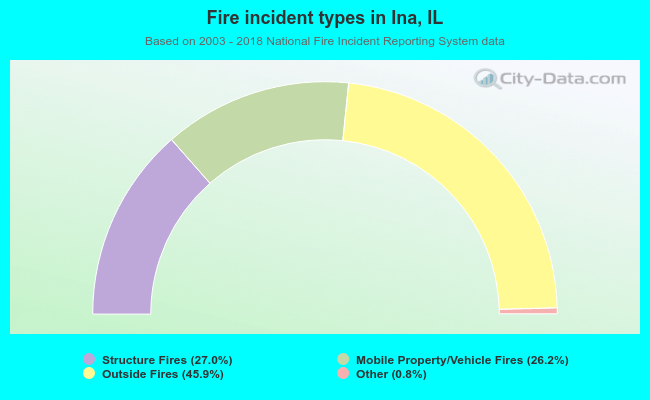 When looking into fire subcategories, the most incidents belonged to: Outside Fires (45.9%), and Structure Fires (27.0%).