Imlay City: Fire Incidents, Michigan (MI)
Where are fire incidents reported in Imlay City, MI
Something went wrong! Please refresh the page.
|
| |||||||||||||||||||||||||||||||||||||||||||||||||||||||||||||||||||||||||||||||||||||||||||||||||||||||||||||
2002 - 2018 National Fire Incident Reporting System (NFIRS) incidents
- Incident types reported to NFIRS in Imlay City, MI
- 52736.7%Hazardous Condition
- 48733.9%Fire
- 1299.0%Service Call
- 1188.2%False Alarm
- 1097.6%Good Intent Call
- 503.5%Rescue & EMS
- 80.6%Overpressure Rupture
- 50.3%Special Incident
- 40.3%Severe Weather
- Fire incident types reported to NFIRS in Imlay City, MI
- 27656.7%Structure Fires
- 10822.2%Outside Fires
- 7114.6%Mobile Property/Vehicle Fires
- 326.6%Other
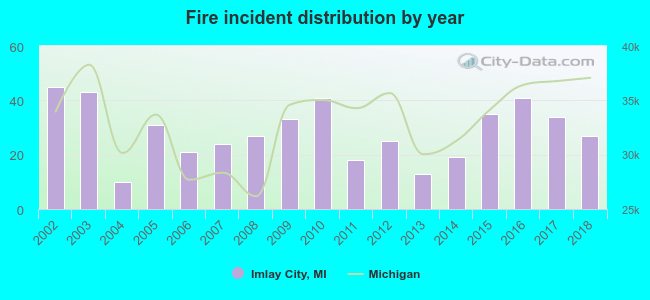 Based on the data from the years 2002 - 2018 the average number of fires per year is 29. The highest number of fires - 45 took place in 2002, and the least - 10 in 2004. The data has a decreasing trend.
 Based on the data from the years 2002 - 2018 the average number of fire-related yearly deaths is 0. The highest number of reported deaths - 2 took place in 2002, and the lowest - 0 in 2003. The data has a declining trend.
 34.5% incidents where reported in the morning and 65.5% in the evening. The most fires (22.8%) took place on Wednesday, and the least (10.5%) on Saturday.
 Based on the 487 incident reports from years 2002 - 2018 most fires (13.8%) took place during April, and the least (6.0%) in November.
 Out of all 1,437 cases reported during the years 2002 - 2018, the most belonged to the categories: Hazardous Condition (36.7%), Fire (33.9%), and Service Call (9.0%).
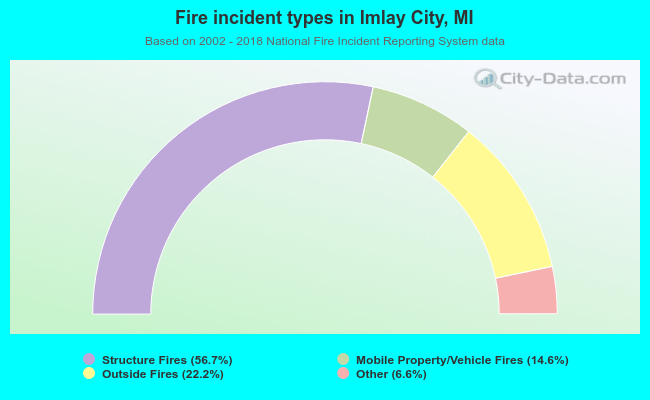 When looking into fire subcategories, the most reports belonged to: Structure Fires (56.7%), and Outside Fires (22.2%).