Huntington: Fire Incidents, West Virginia (WV)
Where are fire incidents reported in Huntington, WV
Something went wrong! Please refresh the page.
| Fire incidents reported | |
|---|---|
| Sreet name | Count |
| 5TH AVE | 252 |
| WASHINGTON AVE | 194 |
| 4TH AVE | 158 |
| FIFTH AVE | 158 |
| 3RD AVE | 152 |
| 9TH AVE | 138 |
| 6TH AVE | 132 |
| ADAMS AVE | 132 |
| ROUTE 60 | 110 |
| THIRD AVE | 110 |
| 7TH AVE | 106 |
| MADISON AVE | 100 |
| 10TH AVE | 96 |
| FOURTH AVE | 94 |
| US ROUTE 60 | 90 |
| 8TH AVE | 86 |
| MONROE AVE | 84 |
| GREEN VALLEY RD | 82 |
| I64 | 82 |
| SEVENTH AVE | 82 |
| JACKSON AVE | 80 |
| SIXTH AVE | 80 |
| ALTIZER AVE | 70 |
| CEDAR CREST DR | 70 |
| CHARLESTON AVE | 70 |
| NINTH AVE | 70 |
| BRIDGE ST | 68 |
| RIVERSIDE DR | 68 |
| JEFFERSON AVE | 66 |
| TENTH AVE | 66 |
| Other | 3,524 |
2004 - 2018 National Fire Incident Reporting System (NFIRS) incidents
- Incident types reported to NFIRS in Huntington, WV
- 9,42229.7%Rescue & EMS
- 6,67021.0%Fire
- 5,98718.9%Hazardous Condition
- 4,41413.9%False Alarm
- 3,54911.2%Good Intent Call
- 1,5014.7%Service Call
- 600.2%Severe Weather
- 560.2%Special Incident
- 410.1%Overpressure Rupture
- Fire incident types reported to NFIRS in Huntington, WV
- 2,79741.9%Structure Fires
- 2,63639.5%Outside Fires
- 92413.9%Mobile Property/Vehicle Fires
- 3134.7%Other
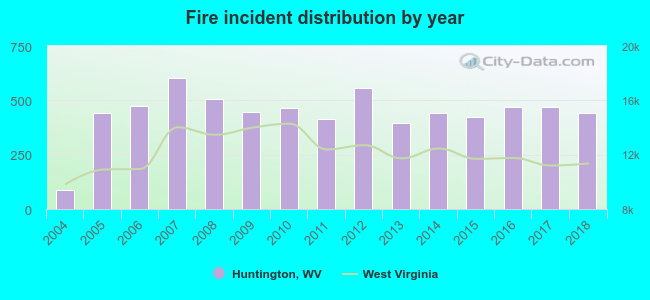 According to the data from the years 2004 - 2018 the average number of fires per year is 442. The highest number of fire incidents - 601 took place in 2007, and the least - 88 in 2004. The data has a rising trend.
The average number of yearly fire incidents per 10k residents in Huntington, WV compared to nearest cities:
(Note: Based on data for the last 3 years, including only cities with population 5,000 and above)
| Huntington: | 94.2 |
| Hurricane: | 93.8 |
| Teays Valley: | 4.8 |
| Nitro: | 89.7 |
| Cross Lanes: | 64.7 |
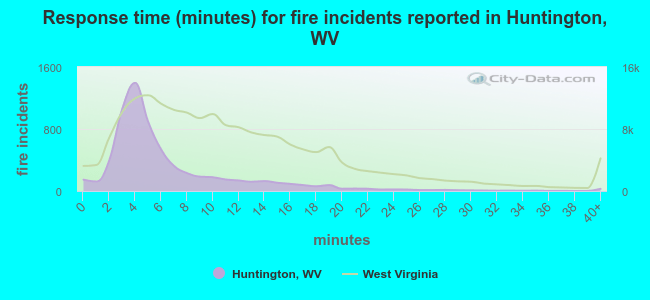 The median response time based on all reported fire incidents is 5 minutes. This is much lower compared to the West Virginia median value.
The median response time in Huntington, WV compared to nearest cities:
(Note: Based on data for all years, including only cities with at least 500 fire incidents)
| Huntington: | 5 minutes |
| Chesapeake: | 12 minutes |
| Proctorville: | 12 minutes |
| Barboursville: | 12 minutes |
| South Point: | 11 minutes |
| Catlettsburg: | 7 minutes |
| Ashland: | 4 minutes |
| Wayne: | 17 minutes |
| Ironton: | 5 minutes |
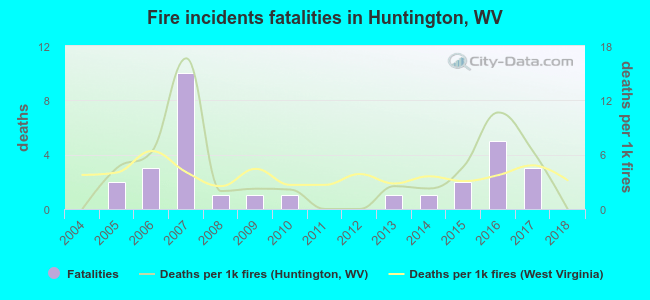 According to the reports from the years 2004 - 2018 the average number of fire-related yearly deaths is 2. The highest number of reported deaths - 10 took place in 2007, and the lowest - 0 in 2004. The data has a constant trend.
The average number of fatalities per 1,000 fire incidents is 4. This indicator was the highest - 17 in 2007, and the lowest 0 in 2004. The trend for fatalities per 1,000 fire incidents is dropping. Compared to the West Virginia value the number of fatalities per 1,000 fires is about the same.
According to the reports from the years 2004 - 2018 the average number of fire-related yearly deaths is 2. The highest number of reported deaths - 10 took place in 2007, and the lowest - 0 in 2004. The data has a constant trend.
The average number of fatalities per 1,000 fire incidents is 4. This indicator was the highest - 17 in 2007, and the lowest 0 in 2004. The trend for fatalities per 1,000 fire incidents is dropping. Compared to the West Virginia value the number of fatalities per 1,000 fires is about the same.Deaths per 1,000 incidents in Huntington, WV compared to nearest cities:
(Note: Based on data for all years, including only cities with at least 2,500 fire incidents)
| Huntington: | 4.5 |
| Ashland: | 1.2 |
| Portsmouth: | 3.1 |
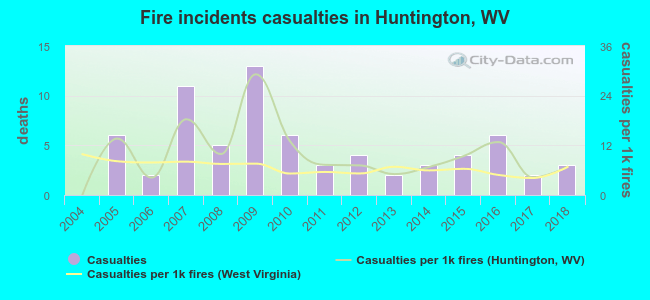 Based on the reports from the years 2004 - 2018 the average number of fire-related yearly casualties is 5. The highest number of reported casualties - 13 took place in 2009, and the lowest - 0 in 2004. The data has a growing trend.
The average number of injuries per 1,000 fire incidents is 10. This indicator was the highest - 29 in 2009, and the lowest 0 in 2004. The trend for casualties per 1,000 incidents is rising. Compared to the West Virginia value the number of casualties per 1,000 fire incidents is higher.
Based on the reports from the years 2004 - 2018 the average number of fire-related yearly casualties is 5. The highest number of reported casualties - 13 took place in 2009, and the lowest - 0 in 2004. The data has a growing trend.
The average number of injuries per 1,000 fire incidents is 10. This indicator was the highest - 29 in 2009, and the lowest 0 in 2004. The trend for casualties per 1,000 incidents is rising. Compared to the West Virginia value the number of casualties per 1,000 fire incidents is higher.Casualties per 1,000 incidents in Huntington, WV compared to nearest cities:
(Note: Based on data for all years, including only cities with at least 500 fire incidents)
| Huntington: | 10.5 |
| Chesapeake: | 2.9 |
| Proctorville: | 2.7 |
| Barboursville: | 8.1 |
| South Point: | 0.8 |
| Catlettsburg: | 9.4 |
| Ashland: | 3.6 |
| Wayne: | 1.9 |
| Ironton: | 14.5 |
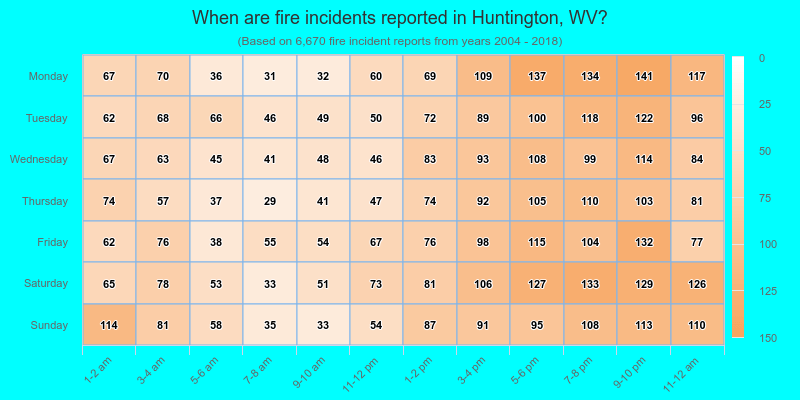
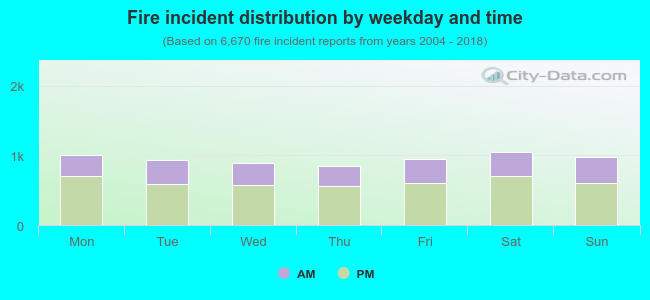 34.7% incidents where reported in the morning and 65.3% in the evening. The most fires (15.8%) took place on Saturday, and the least (12.7%) on Thursday.
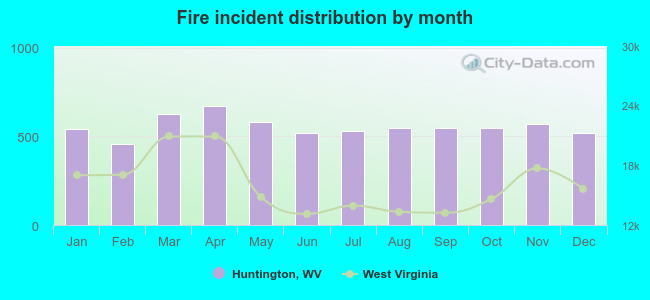 Based on the 6,670 fires from years 2004 - 2018 most fires (10.1%) took place during April, and the least (6.9%) in February.
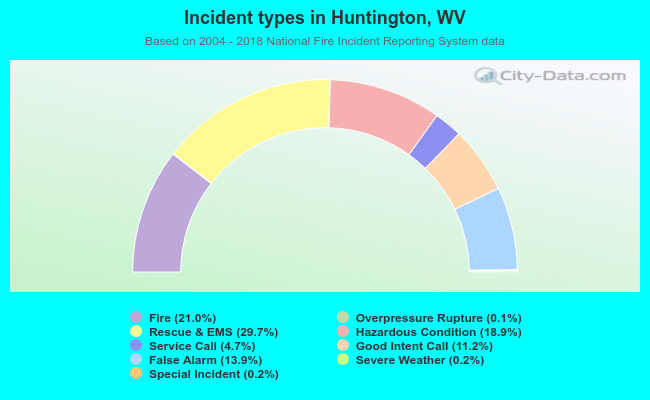 Out of all 31,700 cases reported during the years 2004 - 2018, the most belonged to the categories: Rescue & EMS (29.7%), Fire (21.0%), and Hazardous Condition (18.9%).
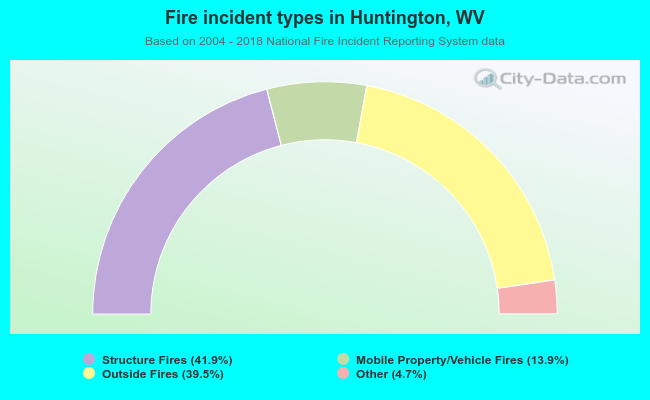 When looking into fire subcategories, the most incidents belonged to: Structure Fires (41.9%), and Outside Fires (39.5%).