Huntington: Fire Incidents, Texas (TX)
Where are fire incidents reported in Huntington, TX
Something went wrong! Please refresh the page.
|
| |||||||||||||||||||||||||||||||||||||||||||||||||||||||||||||||||||||||||||||||||||||||||||||||||||||||||||||
| Other | 78 | |||||||||||||||||||||||||||||||||||||||||||||||||||||||||||||||||||||||||||||||||||||||||||||||||||||||||||||
2003 - 2016 National Fire Incident Reporting System (NFIRS) incidents
- Incident types reported to NFIRS in Huntington, TX
- 33048.0%Fire
- 16223.6%Rescue & EMS
- 10014.6%Hazardous Condition
- 7611.1%Good Intent Call
- 91.3%False Alarm
- 81.2%Service Call
- 20.3%Severe Weather
- Fire incident types reported to NFIRS in Huntington, TX
- 18154.8%Outside Fires
- 10030.3%Structure Fires
- 298.8%Mobile Property/Vehicle Fires
- 206.1%Other
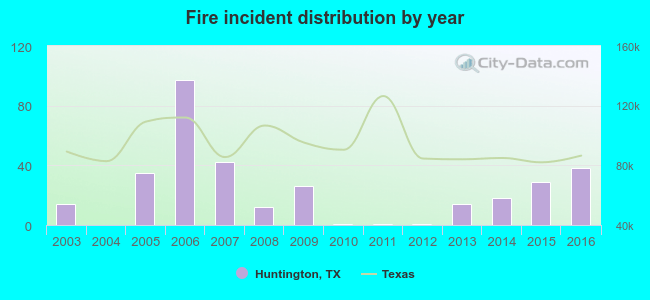 Based on the data from the years 2003 - 2016 the average number of fires per year is 23. The highest number of reported fire incidents - 97 took place in 2006, and the least - 0 in 2004. The data has an increasing trend.
 19.4% incidents where reported in the morning and 80.6% in the evening. The most fires (15.5%) took place on Saturday, and the least (13.0%) on Friday.
 According to the 330 incident reports from years 2003 - 2016 most fires (13.6%) took place during January, and the least (3.6%) in October.
 Out of all 687 cases reported during the years 2003 - 2016, the most belonged to the categories: Fire (48.0%), Overpressure Rupture (23.6%), and Rescue & EMS (14.6%).
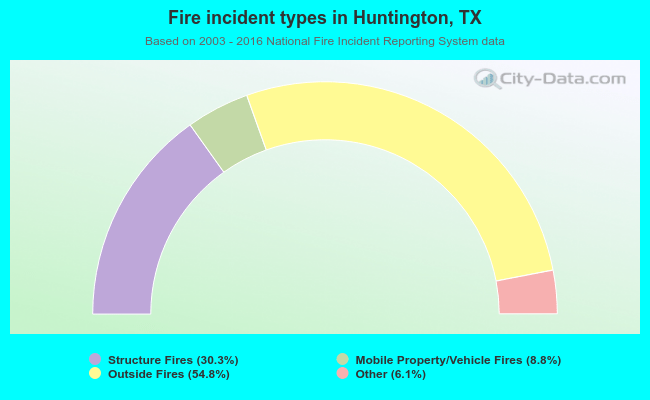 When looking into fire subcategories, the most incidents belonged to: Outside Fires (54.8%), and Structure Fires (30.3%).