Huntington: Fire Incidents, Arkansas (AR)
Where are fire incidents reported in Huntington, AR
Something went wrong! Please refresh the page.
|
| |||||||||||||||||||||||||||||||||||||||||||||||||||||||||||||||||||||||||||||||||||||||||||||||||||||||||||||
2002 - 2018 National Fire Incident Reporting System (NFIRS) incidents
- Incident types reported to NFIRS in Huntington, AR
- 49367.0%Fire
- 9412.8%Rescue & EMS
- 628.4%Hazardous Condition
- 415.6%Good Intent Call
- 253.4%Service Call
- 121.6%False Alarm
- 91.2%Severe Weather
- Fire incident types reported to NFIRS in Huntington, AR
- 26654.0%Outside Fires
- 20241.0%Structure Fires
- 193.9%Mobile Property/Vehicle Fires
- 61.2%Other
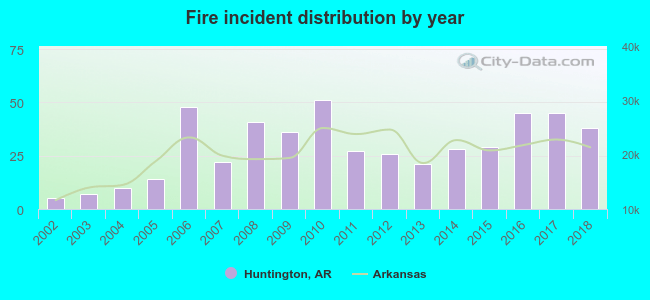 Based on the data from the years 2002 - 2018 the average number of fire incidents per year is 29. The highest number of reported fires - 51 took place in 2010, and the least - 5 in 2002. The data has an increasing trend.
 26.6% incidents where reported in the morning and 73.4% in the evening. The most fires (16.2%) took place on Monday, and the least (12.0%) on Thursday.
 According to the 493 fire incident reports from years 2002 - 2018 most fires (17.6%) took place during January, and the least (3.2%) in September.
 Out of all 736 cases reported during the years 2002 - 2018, the most belonged to the categories: Fire (67.0%), Overpressure Rupture (12.8%), and Rescue & EMS (8.4%).
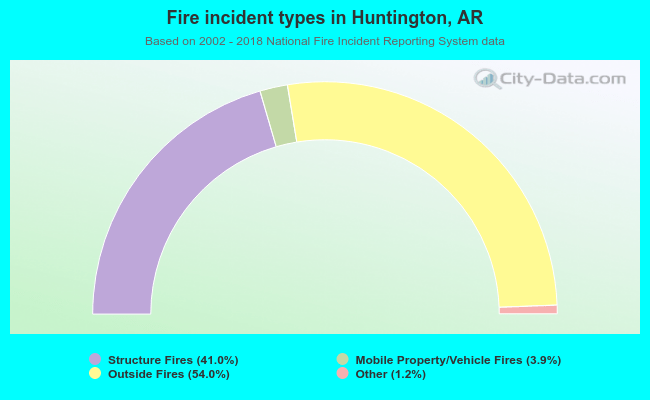 When looking into fire subcategories, the most incidents belonged to: Outside Fires (54.0%), and Structure Fires (41.0%).