| Fire incidents reported |
|---|
| Sreet name | Count |
|---|
| HWY 112 | 8 | | HOLMES RD | 6 | | HWY 24 | 4 | | STATE HWY 14 | 4 | | 1000 RIVERSIDE RD. | 2 | | 103 LANE JONES RD. | 2 | | 131 HWY 24 | 2 | | 1431 NEW HAVEN ROAD | 2 | | 1657 HWY 24 | 2 | | 1763 HIGHWAY 24 | 2 | | 17903 HWY 14 | 2 | | 1846 HWY 112 MONA ROAD | 2 | | 1902 HWY 24 | 2 | | 206 NEW HAVEN ROAD | 2 | | 220 NEW HAVEN | 2 | | 2915 HIGHWAY 24 | 2 | | 3 MILES FROM REDDING RANCH | 2 | | 333 SHAW ROAD | 2 | | 436 GOVERNMENT CANYON ROAD | 2 | | 513 DEER CREEK RD. | 2 | | 575 GOLDIE DIVIDE ROAD | 2 | | 863 MONA ROAD | 2 | | 906.5 ALZADA RD. | 2 | | AMISH COMMUNITY | 2 | | BEARLODGE FOREST PROUCTS | 2 |
| | | Fire incidents reported |
|---|
| Sreet name | Count |
|---|
| BRUSH HOLLOW | 2 | | COLEMAN RANCH | 2 | | DEER CREEK | 2 | | DEER CREEK ROAD RD | 2 | | EWING RD | 2 | | FA BUSH RANCH | 2 | | FOWLER RANCH | 2 | | HIGHWAY 112 | 2 | | HIGHWAY 212 | 2 | | HWY 14 | 2 | | HWY 24 EAST OF DEVILS TOWER | 2 | | HWY 24 MP 9 | 2 | | HWY 24 SOUTH | 2 | | HWY 24-BEARLODGE NAT'LE | 2 | | HYW24 | 2 | | JOINER RIDGE DEVILS TOWER | 2 | | KNOLL OF LYTLE CREEK | 2 | | LAME JONES | 2 | | LAME JONES RD BLACK TAIL CRK | 2 | | LYTLE CREEK ROAD | 2 | | LYTLE CREEK ROAD RD | 2 | | MILLER CREEK | 2 | | N44 44 437 W104 37 328 | 2 | | NELSON ROAD | 2 | | |
|
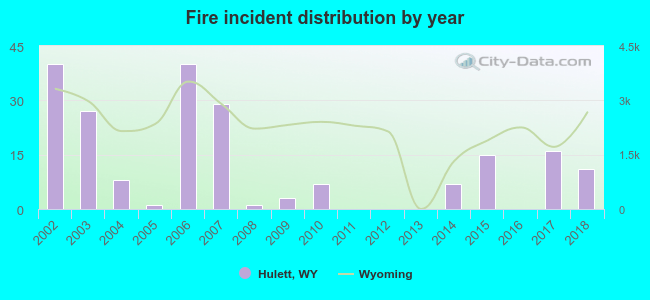 According to the data from the years 2002 - 2018 the average number of fire incidents per year is 12. The highest number of reported fire incidents - 40 took place in 2002, and the least - 0 in 2011. The data has a dropping trend.
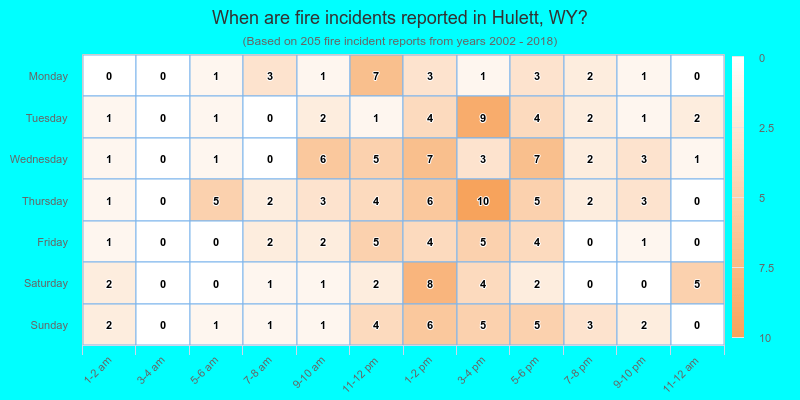
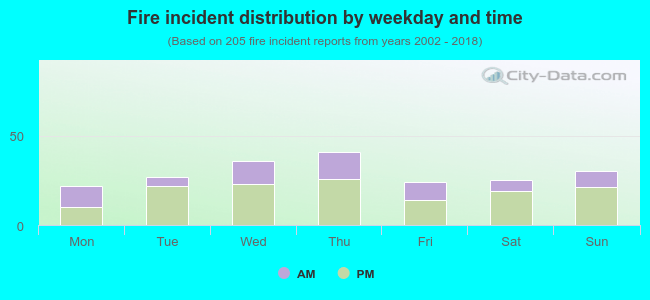 34.1% incidents where reported in the morning and 65.9% in the evening. The most fires (20.0%) took place on Thursday, and the least (10.7%) on Monday.
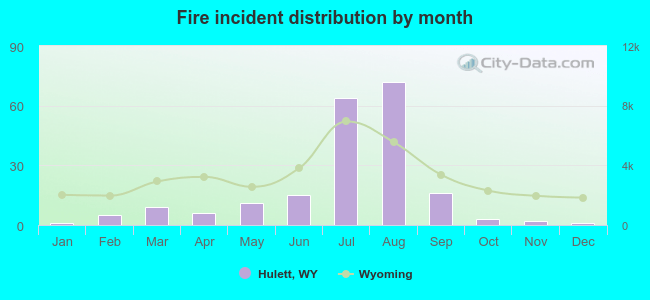 Based on the 205 fire incidents from years 2002 - 2018 most fires (35.1%) took place during August, and the least (0.5%) in January.
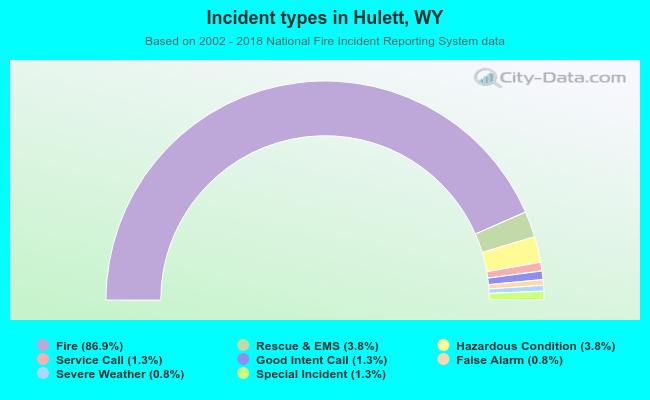 Out of all 236 cases reported during the years 2002 - 2018, the most belonged to the categories: Fire (86.9%), Overpressure Rupture (3.8%), and Rescue & EMS (3.8%).
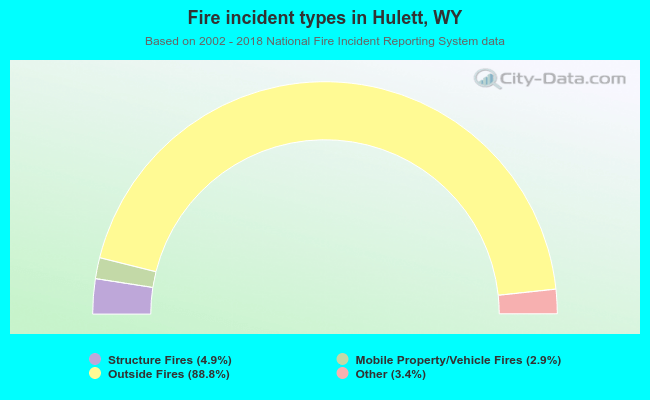 When looking into fire subcategories, the most incidents belonged to: Outside Fires (88.8%), and Structure Fires (4.9%).