Hughesville: Fire Incidents, Pennsylvania (PA)
Where are fire incidents reported in Hughesville, PA
Something went wrong! Please refresh the page.
|
| |||||||||||||||||||||||||||||||||||||||||||||||||||||||||||||||||||||||||||||||||||||||||||||||||||||||||||||
2005 - 2018 National Fire Incident Reporting System (NFIRS) incidents
- Incident types reported to NFIRS in Hughesville, PA
- 24945.5%Fire
- 8715.9%Hazardous Condition
- 7613.9%Rescue & EMS
- 539.7%Good Intent Call
- 488.8%Service Call
- 162.9%False Alarm
- 142.6%Severe Weather
- 40.7%Special Incident
- Fire incident types reported to NFIRS in Hughesville, PA
- 14759.0%Structure Fires
- 6325.3%Outside Fires
- 228.8%Mobile Property/Vehicle Fires
- 176.8%Other
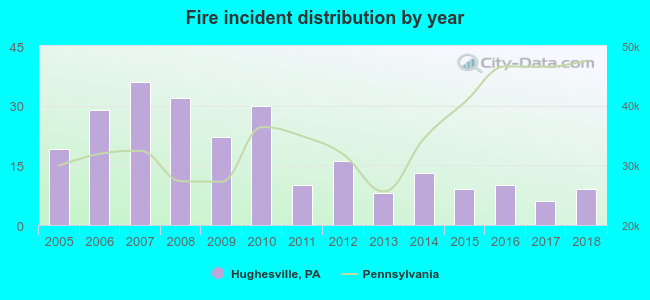 According to the data from the years 2005 - 2018 the average number of fire incidents per year is 18. The highest number of reported fire incidents - 36 took place in 2007, and the least - 6 in 2017. The data has a decreasing trend.
 31.7% incidents where reported in the morning and 68.3% in the evening. The most fires (19.3%) took place on Thursday, and the least (10.4%) on Sunday.
 According to the 249 fires from years 2005 - 2018 most fires (18.1%) took place during February, and the least (3.2%) in December.
 Out of all 547 cases reported during the years 2005 - 2018, the most belonged to the categories: Fire (45.5%), Rescue & EMS (15.9%), and Overpressure Rupture (13.9%).
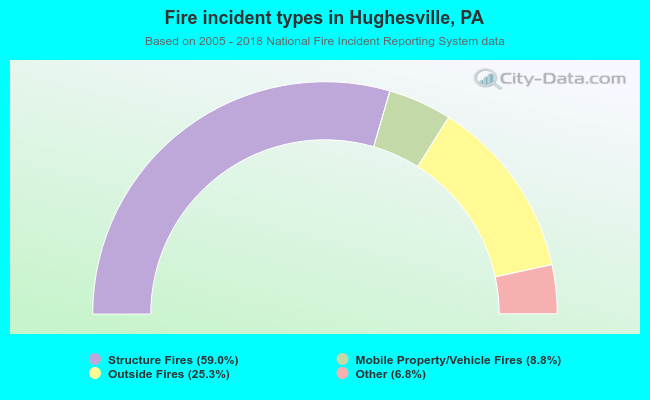 When looking into fire subcategories, the most reports belonged to: Structure Fires (59.0%), and Outside Fires (25.3%).