Hudson: Fire Incidents, Michigan (MI)
Where are fire incidents reported in Hudson, MI
Something went wrong! Please refresh the page.
|
| |||||||||||||||||||||||||||||||||||||||||||||||||||||||||||||||||||||||||||||||||||||||||||||||||||||||||||||
2002 - 2018 National Fire Incident Reporting System (NFIRS) incidents
- Incident types reported to NFIRS in Hudson, MI
- 44229.7%Rescue & EMS
- 39026.2%Fire
- 31621.3%Hazardous Condition
- 926.2%Service Call
- 795.3%Good Intent Call
- 583.9%Severe Weather
- 563.8%Special Incident
- 432.9%False Alarm
- 110.7%Overpressure Rupture
- Fire incident types reported to NFIRS in Hudson, MI
- 17043.6%Structure Fires
- 15339.2%Outside Fires
- 348.7%Other
- 338.5%Mobile Property/Vehicle Fires
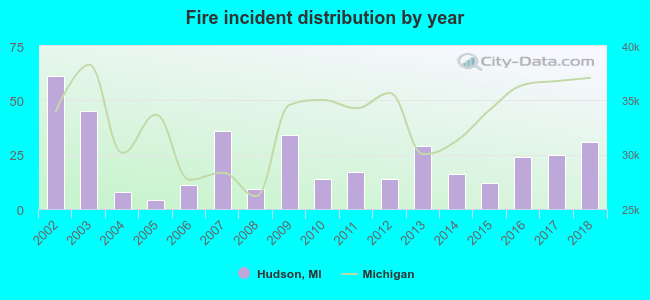 Based on the data from the years 2002 - 2018 the average number of fires per year is 23. The highest number of fires - 61 took place in 2002, and the least - 4 in 2005. The data has a decreasing trend.
 28.5% incidents where reported in the morning and 71.5% in the evening. The most fires (17.4%) took place on Saturday, and the least (9.7%) on Friday.
 Based on the 390 fire incident reports from years 2002 - 2018 most fires (19.0%) took place during March, and the least (3.8%) in September.
 Out of all 1,487 cases reported during the years 2002 - 2018, the most belonged to the categories: Rescue & EMS (29.7%), Fire (26.2%), and Hazardous Condition (21.3%).
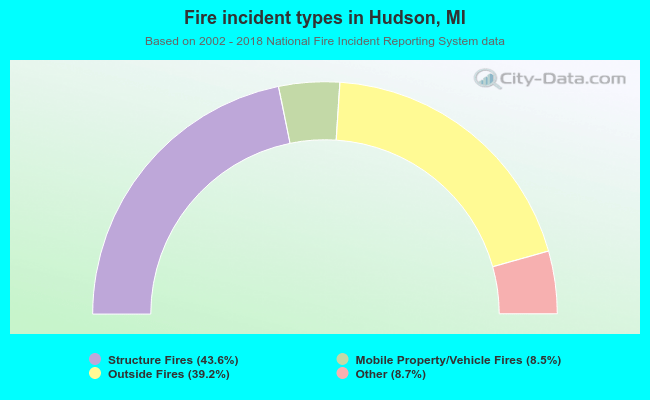 When looking into fire subcategories, the most reports belonged to: Structure Fires (43.6%), and Outside Fires (39.2%).