| Fire incidents reported |
|---|
| Sreet name | Count |
|---|
| RON SMITH MEMORIAL HWY | 8 | | 1475 EAST RD | 6 | | 1600 EAST RD | 6 | | BROADWAY | 6 | | EAST | 6 | | EAST ST | 6 | | WALNUT | 6 | | ZIEBARTH RD | 6 | | 13001 RECREATION AREA DR | 4 | | 1500 EAST RD | 4 | | 17819 CLARK DRIVE | 4 | | 19336 N 1425 EAST RD | 4 | | 2200 NORTH RD | 4 | | 2300 NORTH RD | 4 | | 2500 NORTH RD | 4 | | CLARK DR | 4 | | FRANKLIN ST | 4 | | I-39 MM2 | 4 | | I39 MM3 | 4 | | LAKE BLOOMINGTON | 4 | | LINDEN ST | 4 | | LOCUST ST | 4 | | NORTHTOWN RD | 4 | | PJ KELLER HWY | 4 | | WALDEN RD | 4 |
| | | Fire incidents reported |
|---|
| Sreet name | Count |
|---|
| WEST | 4 | | 102 DOVE CT | 2 | | 1200 EAST RD | 2 | | 12467 E 2200 N | 2 | | 12754 E 2300 N RD | 2 | | 1300 EAST RD | 2 | | 13001 RECREATIONAL DR | 2 | | 1350 EAST | 2 | | 1350 EAST RD | 2 | | 1350E | 2 | | 13774 E 2300 N | 2 | | 1425 EAST ROAD | 2 | | 1425 N | 2 | | 14753 E 2100 N | 2 | | 15084 E 2100 N RD | 2 | | 1600 E 2000N | 2 | | 1700 E RD | 2 | | 1700 EAST | 2 | | 1700 EAST RD | 2 | | 18319 TEEPEE TRAIL | 2 | | 18320 KICKAPOO LN. | 2 | | 18504 HAZEL CT | 2 | | 19349 N 1425 E | 2 | | 19580 N 1800 E | 2 | | |
|
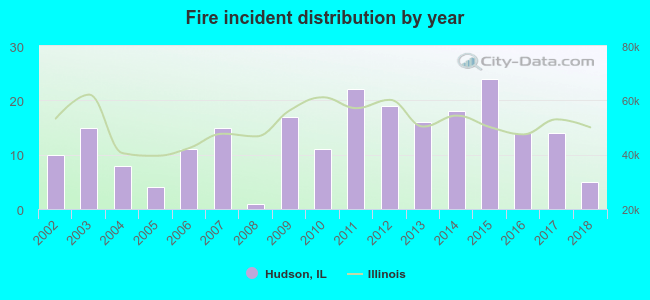 According to the data from the years 2002 - 2018 the average number of fire incidents per year is 13. The highest number of fire incidents - 24 took place in 2015, and the least - 1 in 2008. The data has a declining trend.
 26.3% incidents where reported in the morning and 73.7% in the evening. The most fires (18.8%) took place on Friday, and the least (10.7%) on Monday.
 According to the 224 incident reports from years 2002 - 2018 most fires (13.4%) took place during April, and the least (3.6%) in September.
 Out of all 904 cases reported during the years 2002 - 2018, the most belonged to the categories: Rescue & EMS (54.5%), Fire (24.8%), and Hazardous Condition (7.1%).
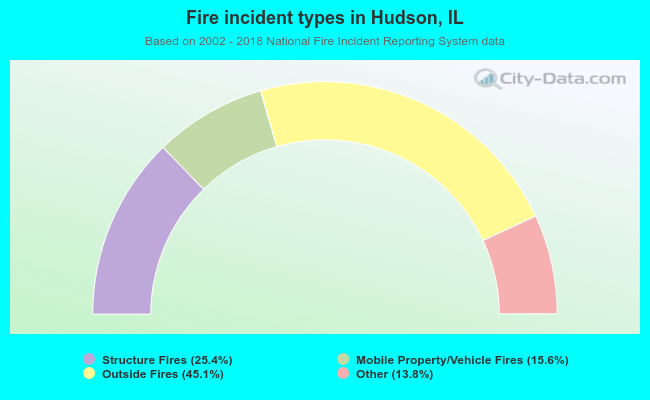 When looking into fire subcategories, the most reports belonged to: Outside Fires (45.1%), and Structure Fires (25.4%).