| Fire incidents reported |
|---|
| Sreet name | Count |
|---|
| HWY 38 | 8 | | I 15 | 8 | | I-15 MP 375 | 8 | | I15 | 6 | | 5900 NORTH HWY 38 | 4 | | 8215 N. HWY 38 | 4 | | I-15 MP 370 | 4 | | MM 372 | 4 | | 13230 NORTH 3100 WEST | 2 | | 2340 NORTH CALLS FORT ROAD | 2 | | 2540 W 7000 N | 2 | | 2550 | 2 | | 2550 WEST 6980 NORTH | 2 | | 2620 W 6980 N | 2 | | 2670 W. 7200 N. | 2 | | 2800 W 7200 N | 2 | | 2950 W. | 2 | | 2990 WEST 6900 NORTH | 2 | | 3100 W 4100 N | 2 | | 3597 N HWY 38 | 2 | | 3600 | 2 | | 3600 W. 5600 N` | 2 | | 3750 W 7200 N | 2 | | 3750 WEST 7200 NORTH | 2 | | 4000 W. 6900 N | 2 |
| | | Fire incidents reported |
|---|
| Sreet name | Count |
|---|
| 4100 W. 6900 N | 2 | | 4330 WEST 6000 N | 2 | | 4553 N HWY 38 | 2 | | 4600 N 3049 W | 2 | | 5000 N 3600 W | 2 | | 5100 N. HWY 38 | 2 | | 5600 N. HWY 38 | 2 | | 5600 NORTH 3000 W. | 2 | | 5700 N. HWY 38 | 2 | | 6057 NORTH 4400 WEST | 2 | | 6060 N HWY 38 | 2 | | 6170 N HWY 38 | 2 | | 6171 NORTH HWY 38 | 2 | | 6405 SALT CREEK ROAD | 2 | | 6680 N 3002 W | 2 | | 6742 NORTH HWY 38 | 2 | | 6800 N 5600 W | 2 | | 6800 NORTH HWY 38 | 2 | | 6800 NORTH SR 38 | 2 | | 6820 NORTH SALT CREEK RD | 2 | | 6900 N 3945 W LGTS | 2 | | 6900 N HWY 38 | 2 | | 6900 N. 2350 W. | 2 | | 6900 N. 3600 W. | 2 | | |
|
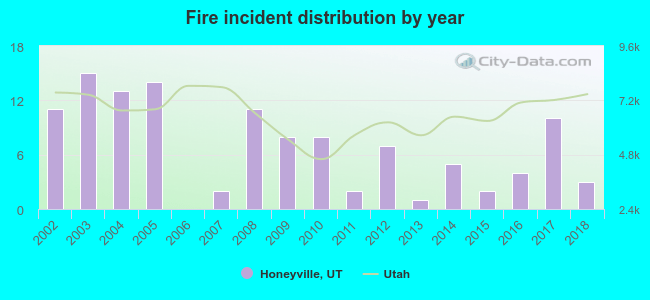 According to the data from the years 2002 - 2018 the average number of fires per year is 7. The highest number of reported fires - 15 took place in 2003, and the least - 0 in 2006. The data has a declining trend.
 23.3% incidents where reported in the morning and 76.7% in the evening. The most fires (18.1%) took place on Saturday, and the least (10.3%) on Tuesday.
 Based on the 116 fire incident reports from years 2002 - 2018 most fires (20.7%) took place during July, and the least (1.7%) in February.
 Out of all 445 cases reported during the years 2002 - 2018, the most belonged to the categories: Rescue & EMS (53.0%), Fire (26.1%), and Hazardous Condition (9.4%).
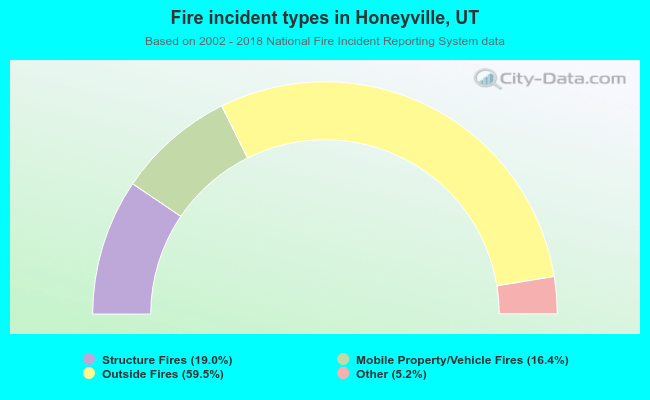 When looking into fire subcategories, the most reports belonged to: Outside Fires (59.5%), and Structure Fires (19.0%).