Honesdale: Fire Incidents, Pennsylvania (PA)
Where are fire incidents reported in Honesdale, PA
Something went wrong! Please refresh the page.
|
| |||||||||||||||||||||||||||||||||||||||||||||||||||||||||||||||||||||||||||||||||||||||||||||||||||||||||||||
| Other | 36 | |||||||||||||||||||||||||||||||||||||||||||||||||||||||||||||||||||||||||||||||||||||||||||||||||||||||||||||
2003 - 2018 National Fire Incident Reporting System (NFIRS) incidents
- Incident types reported to NFIRS in Honesdale, PA
- 35727.9%Rescue & EMS
- 26220.5%Fire
- 19515.2%Hazardous Condition
- 17513.7%False Alarm
- 15011.7%Service Call
- 886.9%Good Intent Call
- 292.3%Severe Weather
- 241.9%Special Incident
- Fire incident types reported to NFIRS in Honesdale, PA
- 17566.8%Structure Fires
- 5019.1%Outside Fires
- 228.4%Other
- 155.7%Mobile Property/Vehicle Fires
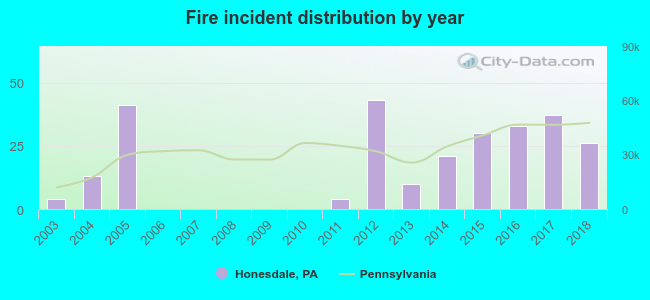 Based on the data from the years 2003 - 2018 the average number of fires per year is 16. The highest number of fires - 43 took place in 2012, and the least - 0 in 2006. The data has an increasing trend.
 32.4% incidents where reported in the morning and 67.6% in the evening. The most fires (17.6%) took place on Tuesday, and the least (12.2%) on Thursday.
 Based on the 262 incident reports from years 2003 - 2018 most fires (18.3%) took place during March, and the least (1.5%) in October.
 Out of all 1,280 cases reported during the years 2003 - 2018, the most belonged to the categories: Overpressure Rupture (27.9%), Fire (20.5%), and Rescue & EMS (15.2%).
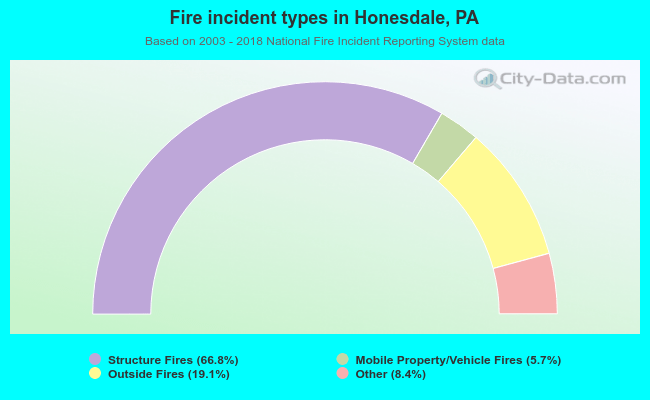 When looking into fire subcategories, the most reports belonged to: Structure Fires (66.8%), and Outside Fires (19.1%).