Hometown: Fire Incidents, Illinois (IL)
Where are fire incidents reported in Hometown, IL
Something went wrong! Please refresh the page.
|
| |||||||||||||||||||||||||||||||||||||||||||||||||||||||||||||||||||||||||||||||||||||||||||||||||||||||||||||
2002 - 2018 National Fire Incident Reporting System (NFIRS) incidents
- Incident types reported to NFIRS in Hometown, IL
- 1,58452.7%Rescue & EMS
- 52717.5%Hazardous Condition
- 33711.2%Fire
- 2408.0%Good Intent Call
- 1806.0%False Alarm
- 1284.3%Service Call
- 50.2%Special Incident
- 40.1%Overpressure Rupture
- Fire incident types reported to NFIRS in Hometown, IL
- 22867.7%Structure Fires
- 5917.5%Outside Fires
- 298.6%Mobile Property/Vehicle Fires
- 216.2%Other
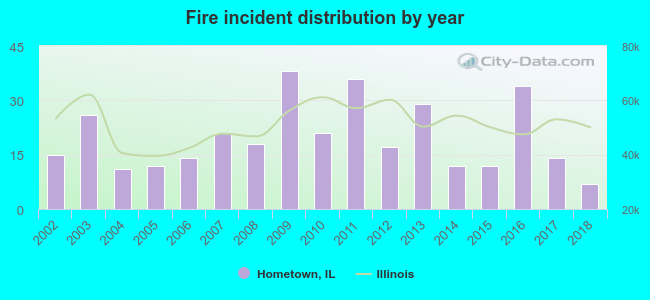 Based on the data from the years 2002 - 2018 the average number of fire incidents per year is 20. The highest number of fire incidents - 38 took place in 2009, and the least - 7 in 2018. The data has a declining trend.
 According to the reports from the years 2002 - 2018 the average number of fire-related casualties per year is 0. The highest number of reported casualties - 2 took place in 2005, and the lowest - 0 in 2002. The data has a constant trend.
 30.3% incidents where reported in the morning and 69.7% in the evening. The most fires (19.0%) took place on Monday, and the least (7.1%) on Sunday.
 According to the 337 fire incidents from years 2002 - 2018 most fires (12.8%) took place during May, and the least (5.6%) in June.
 Out of all 3,007 cases reported during the years 2002 - 2018, the most belonged to the categories: Rescue & EMS (52.7%), Hazardous Condition (17.5%), and Fire (11.2%).
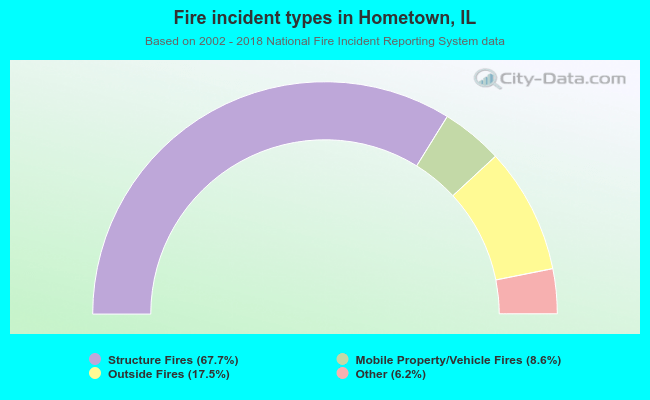 When looking into fire subcategories, the most incidents belonged to: Structure Fires (67.7%), and Outside Fires (17.5%).