Homestead: Fire Incidents, Florida (FL)
Where are fire incidents reported in Homestead, FL
Something went wrong! Please refresh the page.
| Fire incidents reported | |
|---|---|
| Sreet name | Count |
| MOWRY DR | 108 |
| 8TH ST | 100 |
| 8 ST | 50 |
| 12TH AVE | 42 |
| 4TH ST | 38 |
| 6TH AVE | 38 |
| KROME AVE | 38 |
| 5TH ST | 36 |
| CAMPBELL DRTPK EXT | 36 |
| HOMESTEAD BLVD | 30 |
| 18TH AVE | 28 |
| 2ND ST | 26 |
| 12 AVE | 24 |
| CAMPBELL DR&TPK EXT | 24 |
| 6 AVE | 22 |
| 9TH ST | 22 |
| SPEEDWAY BLVD | 22 |
| SW 137TH AVESW 320TH ST | 22 |
| 10TH ST | 20 |
| 7TH ST | 20 |
| 15TH PL | 18 |
| 31ST CT | 18 |
| 18 AVE | 16 |
| 4 ST | 16 |
| 1 AVE | 14 |
| 11 ST | 14 |
| 11TH ST | 14 |
| 1ST AVE | 14 |
| 2351 SE 12TH AVE | 14 |
| 6TH ST | 14 |
| Other | 641 |
2008 - 2018 National Fire Incident Reporting System (NFIRS) incidents
- Incident types reported to NFIRS in Homestead, FL
- 29,66181.2%Rescue & EMS
- 1,8525.1%Good Intent Call
- 1,5974.4%False Alarm
- 1,5394.2%Fire
- 1,2603.5%Service Call
- 5961.6%Hazardous Condition
- Fire incident types reported to NFIRS in Homestead, FL
- 74948.7%Outside Fires
- 52334.0%Structure Fires
- 24515.9%Mobile Property/Vehicle Fires
- 221.4%Other
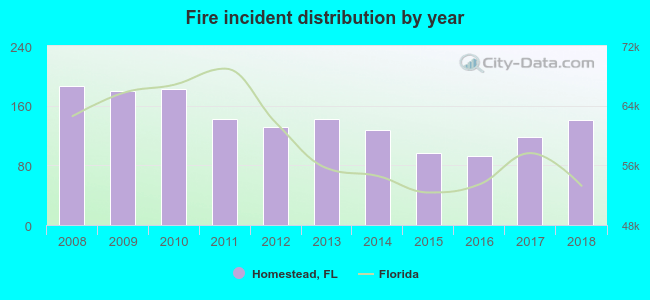 According to the data from the years 2008 - 2018 the average number of fires per year is 140. The highest number of fire incidents - 186 took place in 2008, and the least - 92 in 2016. The data has a decreasing trend.
The average number of yearly fire incidents per 10k residents in Homestead, FL compared to nearest cities:
(Note: Based on data for the last 3 years, including only cities with population 5,000 and above)
| Homestead: | 17.9 |
| Florida City: | 0.8 |
| Cutler Bay: | 13.9 |
| Palmetto Bay: | 9.5 |
| Pinecrest: | 12.6 |
| South Miami: | 15.9 |
| University Park: | 4.8 |
| Sweetwater: | 7.6 |
| Coral Gables: | 13.7 |
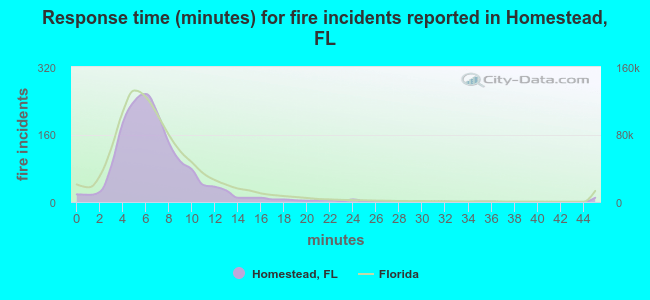 The median response time based on all reported fire incidents is 6 minutes. This is about the same as the state median value.
The median response time in Homestead, FL compared to nearest cities:
(Note: Based on data for all years, including only cities with at least 500 fire incidents)
| Homestead: | 6 minutes |
| Cutler Bay: | 6 minutes |
| Coral Gables: | 5 minutes |
| Key Biscayne: | 4 minutes |
| Doral: | 6 minutes |
| Key Largo: | 5 minutes |
| Miami: | 5 minutes |
| Hialeah: | 7 minutes |
| North Miami: | 6 minutes |
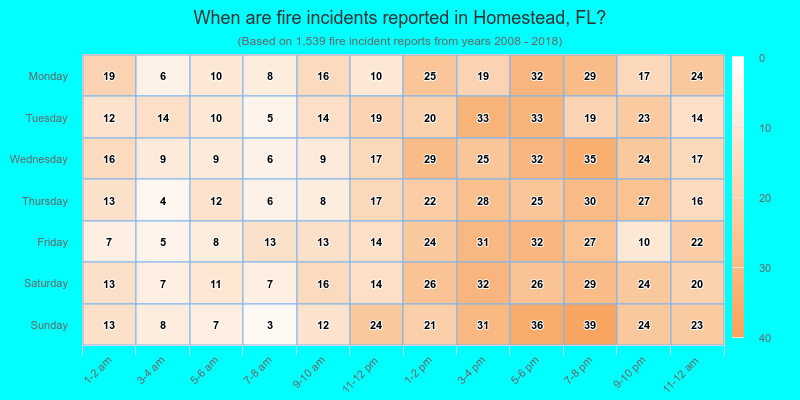
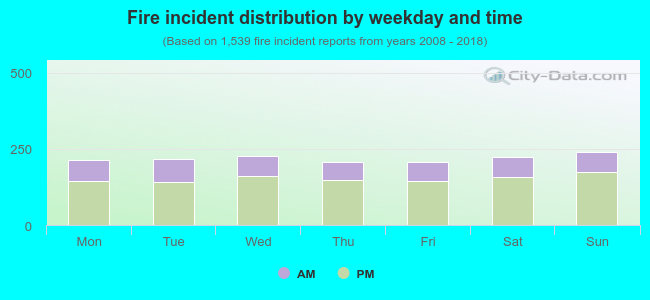 30.1% incidents where reported in the morning and 69.9% in the evening. The most fires (15.7%) took place on Sunday, and the least (13.4%) on Friday.
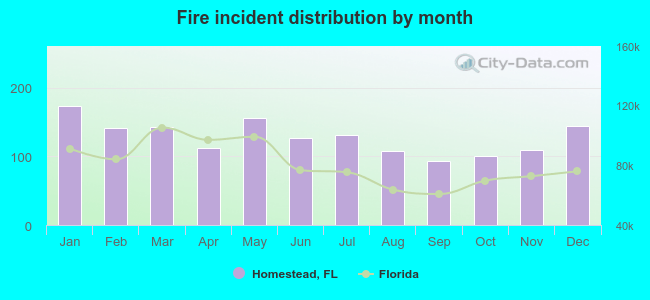 According to the 1,539 incident reports from years 2008 - 2018 most fires (11.3%) took place during January, and the least (6.0%) in September.
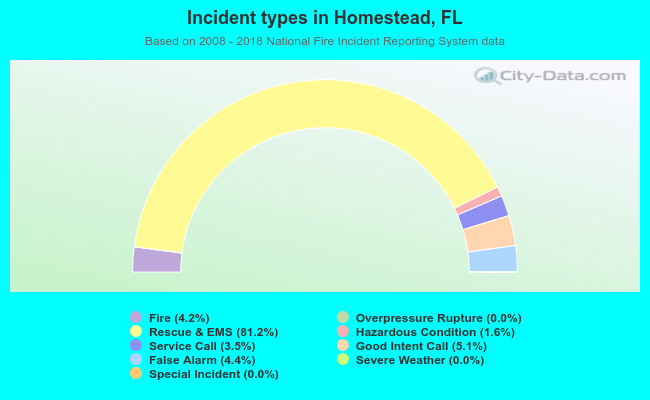 Out of all 36,516 cases reported during the years 2008 - 2018, the most belonged to the categories: Rescue & EMS (81.2%), Good Intent Call (5.1%), and False Alarm (4.4%).
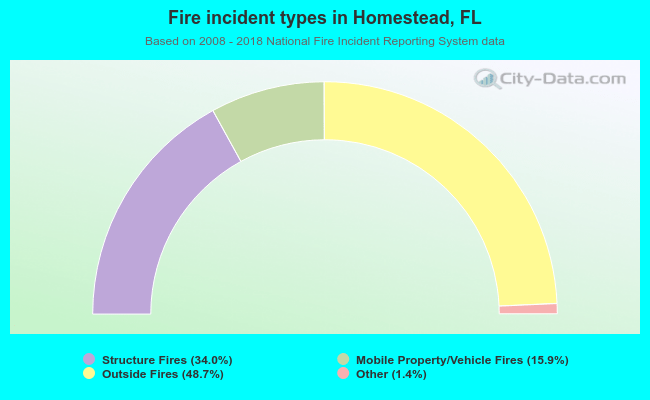 When looking into fire subcategories, the most incidents belonged to: Outside Fires (48.7%), and Structure Fires (34.0%).