Homer: Fire Incidents, Michigan (MI)
Where are fire incidents reported in Homer, MI
Something went wrong! Please refresh the page.
|
| |||||||||||||||||||||||||||||||||||||||||||||||||||||||||||||||||||||||||||||||||||||||||||||||||||||||||||||
2002 - 2018 National Fire Incident Reporting System (NFIRS) incidents
- Incident types reported to NFIRS in Homer, MI
- 38938.0%Fire
- 30629.9%Hazardous Condition
- 14514.2%Rescue & EMS
- 918.9%Service Call
- 444.3%False Alarm
- 393.8%Good Intent Call
- 30.3%Overpressure Rupture
- 30.3%Severe Weather
- 30.3%Special Incident
- Fire incident types reported to NFIRS in Homer, MI
- 19650.4%Structure Fires
- 13534.7%Outside Fires
- 4611.8%Mobile Property/Vehicle Fires
- 123.1%Other
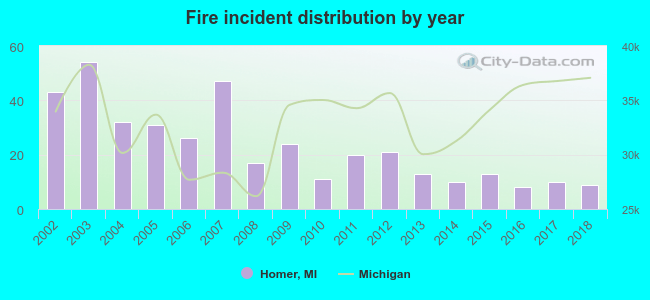 According to the data from the years 2002 - 2018 the average number of fire incidents per year is 23. The highest number of reported fire incidents - 54 took place in 2003, and the least - 8 in 2016. The data has a dropping trend.
 28.8% incidents where reported in the morning and 71.2% in the evening. The most fires (18.8%) took place on Monday, and the least (10.8%) on Saturday.
 According to the 389 fire incidents from years 2002 - 2018 most fires (15.4%) took place during April, and the least (2.8%) in October.
 Out of all 1,023 cases reported during the years 2002 - 2018, the most belonged to the categories: Fire (38.0%), Hazardous Condition (29.9%), and Rescue & EMS (14.2%).
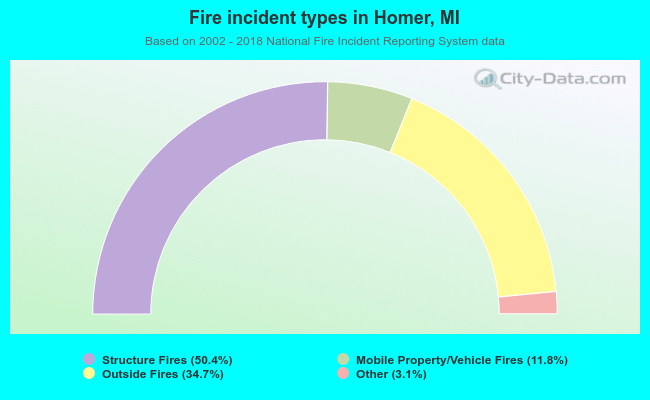 When looking into fire subcategories, the most reports belonged to: Structure Fires (50.4%), and Outside Fires (34.7%).