Holladay: Fire Incidents, Utah (UT)
Where are fire incidents reported in Holladay, UT
Something went wrong! Please refresh the page.
|
| |||||||||||||||||||||||||||||||||||||||||||||||||||||||||||||||||||||||||||||||||||||||||||||||||||||||||||||
2002 - 2018 National Fire Incident Reporting System (NFIRS) incidents
- Incident types reported to NFIRS in Holladay, UT
- 6,71665.3%Rescue & EMS
- 1,0119.8%Good Intent Call
- 8097.9%False Alarm
- 7267.1%Hazardous Condition
- 6176.0%Fire
- 3653.6%Service Call
- 190.2%Special Incident
- Fire incident types reported to NFIRS in Holladay, UT
- 25040.5%Structure Fires
- 24038.9%Outside Fires
- 7512.2%Mobile Property/Vehicle Fires
- 528.4%Other
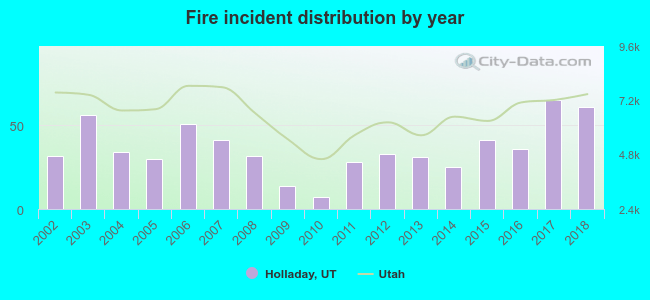 According to the data from the years 2002 - 2018 the average number of fires per year is 36. The highest number of reported fires - 65 took place in 2017, and the least - 7 in 2010. The data has a rising trend.
The average number of yearly fire incidents per 10k residents in Holladay, UT compared to nearest cities:
(Note: Based on data for the last 3 years, including only cities with population 5,000 and above)
| Holladay: | 19.9 |
| East Millcreek: | 1.7 |
| Cottonwood Heights: | 14.6 |
| Millcreek: | 11.9 |
| Murray: | 32.0 |
| Midvale: | 27.1 |
| South Salt Lake: | 44.9 |
| Sandy: | 2.3 |
| Taylorsville: | 20.8 |
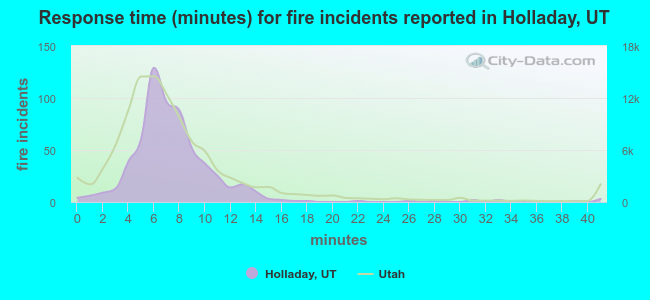 The median response time based on all reported fire incidents is 7 minutes. This is comparable to the state median value.
The median response time in Holladay, UT compared to nearest cities:
(Note: Based on data for all years, including only cities with at least 500 fire incidents)
| Holladay: | 7 minutes |
| Cottonwood Heights: | 7 minutes |
| Murray: | 6 minutes |
| Midvale: | 6 minutes |
| South Salt Lake: | 6 minutes |
| Sandy: | 6 minutes |
| Taylorsville: | 7 minutes |
| Salt Lake City: | 7 minutes |
| West Jordan: | 6 minutes |
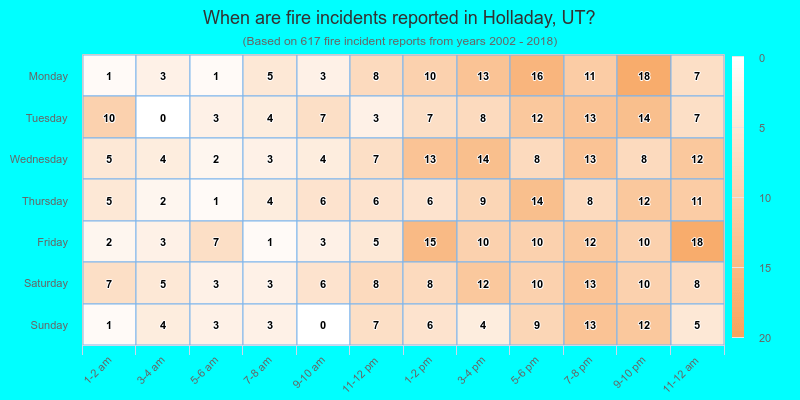
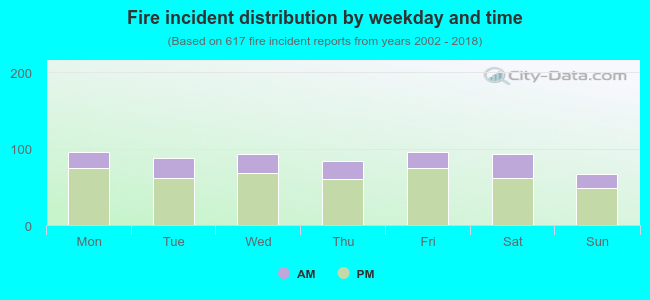 27.2% incidents where reported in the morning and 72.8% in the evening. The most fires (15.6%) took place on Monday, and the least (10.9%) on Sunday.
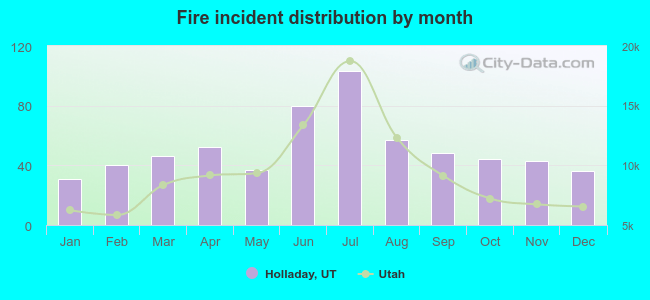 According to the 617 fires from years 2002 - 2018 most fires (16.7%) took place during July, and the least (5.0%) in January.
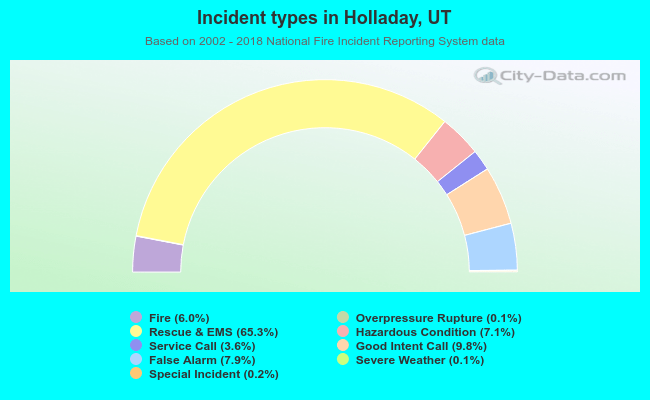 Out of all 10,278 cases reported during the years 2002 - 2018, the most belonged to the categories: Rescue & EMS (65.3%), Good Intent Call (9.8%), and False Alarm (7.9%).
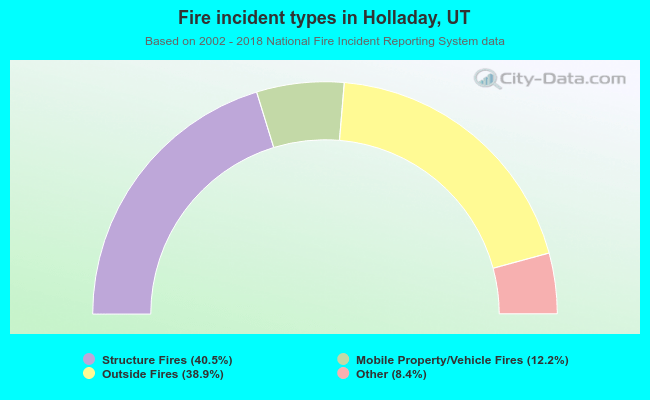 When looking into fire subcategories, the most incidents belonged to: Structure Fires (40.5%), and Outside Fires (38.9%).