Holdenville: Fire Incidents, Oklahoma (OK)
Where are fire incidents reported in Holdenville, OK
Something went wrong! Please refresh the page.
|
| |||||||||||||||||||||||||||||||||||||||||||||||||||||||||||||||||||||||||||||||||||||||||||||||||||||||||||||
| Other | 810 | |||||||||||||||||||||||||||||||||||||||||||||||||||||||||||||||||||||||||||||||||||||||||||||||||||||||||||||
2003 - 2018 National Fire Incident Reporting System (NFIRS) incidents
- Incident types reported to NFIRS in Holdenville, OK
- 1,04457.5%Fire
- 21912.1%Hazardous Condition
- 21611.9%Rescue & EMS
- 1568.6%Service Call
- 1287.0%Good Intent Call
- 422.3%False Alarm
- 60.3%Severe Weather
- 40.2%Special Incident
- Fire incident types reported to NFIRS in Holdenville, OK
- 67264.4%Outside Fires
- 20719.8%Structure Fires
- 11210.7%Mobile Property/Vehicle Fires
- 535.1%Other
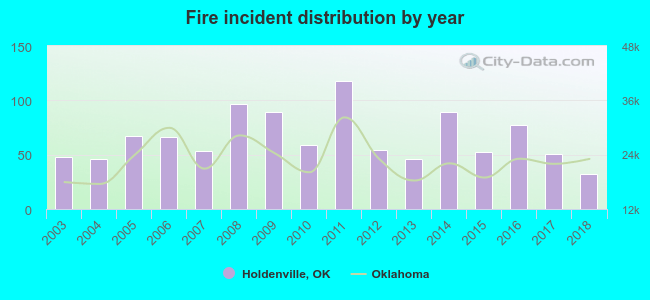 Based on the data from the years 2003 - 2018 the average number of fire incidents per year is 65. The highest number of fire incidents - 118 took place in 2011, and the least - 32 in 2018. The data has a dropping trend.
 The median response time based on all reported fire incidents is 5 minutes. This is lower than the state median value.
The median response time in Holdenville, OK compared to nearest cities:
(Note: Based on data for all years, including only cities with at least 500 fire incidents)
| Holdenville: | 5 minutes |
| Wewoka: | 7 minutes |
| Seminole: | 7 minutes |
| Konawa: | 8 minutes |
| Ada: | 6 minutes |
| Tecumseh: | 7 minutes |
| Henryetta: | 7 minutes |
| Shawnee: | 6 minutes |
| McAlester: | 5 minutes |
 25.0% incidents where reported in the morning and 75.0% in the evening. The most fires (15.6%) took place on Wednesday, and the least (13.0%) on Friday.
 Based on the 1,044 reports from years 2003 - 2018 most fires (11.7%) took place during March, and the least (5.4%) in June.
 Out of all 1,816 cases reported during the years 2003 - 2018, the most belonged to the categories: Fire (57.5%), Hazardous Condition (12.1%), and Rescue & EMS (11.9%).
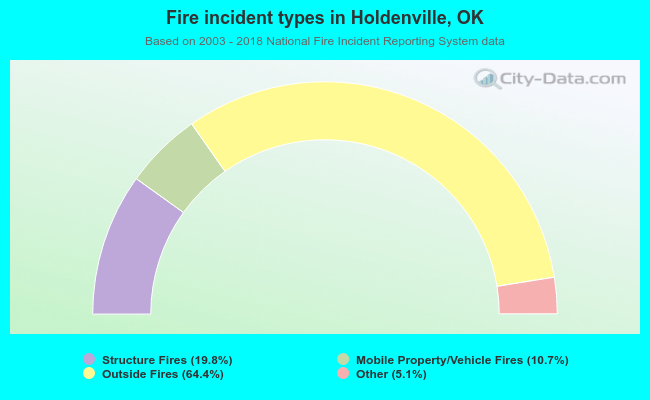 When looking into fire subcategories, the most incidents belonged to: Outside Fires (64.4%), and Structure Fires (19.8%).