| Fire incidents reported |
|---|
| Sreet name | Count |
|---|
| HWY 8 WEST | 56 | | HWY 7 SOUTH | 34 | | HWY 35 SOUTH | 26 | | HWY 8 | 12 | | SPARTA RD | 12 | | SPARTA ROAD | 12 | | SWEETHOME ROAD | 12 | | HOLCOMB/SWEETHOME ROAD | 10 | | HWY 7 | 10 | | GILLON ROAD | 8 | | NASON RD | 8 | | HIGHWAY 8 | 6 | | HOLCOMBSWEETHOME ROAD | 6 | | HWY 35 | 6 | | HWY 35 NORTH | 6 | | HWY 35 S | 6 | | NASON ROAD | 6 | | SWEETHOME RD | 6 | | WHITFEILD ROAD | 6 | | 1101 DUNCAN ROAD | 4 | | 81 CASCILLA RD | 4 | | 858 LODEN ROAD | 4 | | 951 HWY 35 SOUTH | 4 | | HIGHWAY 7 SOUTH | 4 | | HILLSIDE RD | 4 |
| | | Fire incidents reported |
|---|
| Sreet name | Count |
|---|
| LINCOLN RD | 4 | | TUSCOHOMA CHURCH RD | 4 | | 10015 NEAR HWY 8&35 | 2 | | 1100 BLOCK? HWY. 35 SOUTH | 2 | | 11268 HWY 8 WEST | 2 | | 113 LINCOLN RD. | 2 | | 1131 HWY 8 WEST | 2 | | 115 GILLON COVE | 2 | | 1150 SHAW ROAD | 2 | | 117 CROSSROADS | 2 | | 1172 HWY 35 SOUTH | 2 | | 11823HWY8WEST HWY | 2 | | 127 TUSCHOMA ST | 2 | | 129 GILLON COVE | 2 | | 13122 HWT 8 AT DUBARD | 2 | | 14 WILLIAMS ST ST | 2 | | 1568 HWY 35 NORTH | 2 | | 16 SECTION RDS | 2 | | 168 COUNTRY LANE | 2 | | 173 CASCILLA RD | 2 | | 1857 HILLSIDE ROAD | 2 | | 198 CASCILLA | 2 | | 200 SCOTT COVE | 2 | | 248 BIG OAK ROAD | 2 | | |
|
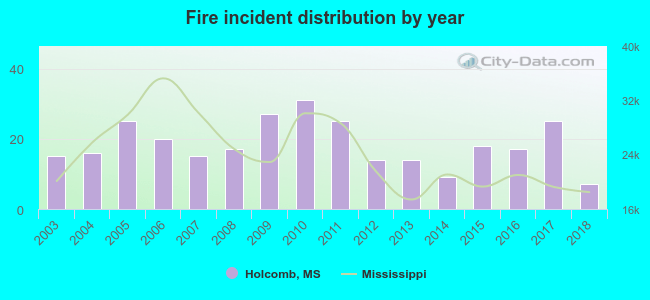 Based on the data from the years 2003 - 2018 the average number of fires per year is 18. The highest number of reported fires - 31 took place in 2010, and the least - 7 in 2018. The data has a dropping trend.
 28.1% incidents where reported in the morning and 71.9% in the evening. The most fires (16.3%) took place on Friday, and the least (12.2%) on Tuesday.
 According to the 295 fire incident reports from years 2003 - 2018 most fires (16.9%) took place during March, and the least (3.4%) in August.
 Out of all 361 cases reported during the years 2003 - 2018, the most belonged to the categories: Fire (81.7%), Rescue & EMS (7.8%), and Hazardous Condition (5.5%).
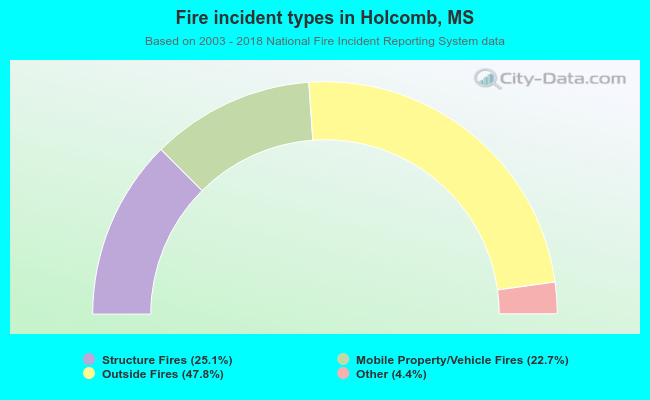 When looking into fire subcategories, the most reports belonged to: Outside Fires (47.8%), and Structure Fires (25.1%).