| Fire incidents reported |
|---|
| Sreet name | Count |
|---|
| 2015 HWY 97 | 20 | | NC 125 | 14 | | HWY 97 | 12 | | 35310 HWY 125 | 6 | | HWY 125 | 6 | | THREE OAKS LN | 6 | | 2ND ST JAMES ST | 4 | | 3208 POOR RD | 4 | | 3679 HOBGOOD RD | 4 | | 407 SOUTH PINE STREET | 4 | | 441 EAST 2ND ST | 4 | | 4703 NC 122 N | 4 | | CANNON ROAD | 4 | | EAST 2ND STREET ST | 4 | | NC 111 | 4 | | NC 97 | 4 | | THREE OAKS LN | 4 | | THREE OAKS LN | 2 | | 101 COMMERCE ST | 2 | | 101 COMMUITY ST | 2 | | 1010 HWY 125 | 2 | | 10326 NC 111 NORTH | 2 | | 104 EAST 5ST | 2 | | 104 EAST 5TH STREET | 2 | | 105 JAMES ST | 2 |
| | | Fire incidents reported |
|---|
| Sreet name | Count |
|---|
| 105 JAMES STREET | 2 | | 106 JAMES STREET | 2 | | 108 RIDDICK STREET | 2 | | 120 MILL POND ROAD | 2 | | 125 EAST | 2 | | 125 S AT MARTIN CO LINE | 2 | | 125 SOUTH OF HOBGOOD NEAR CO L | 2 | | 128 MILL POND RD | 2 | | 173 MAPLETON LANE | 2 | | 1955 SPEED RD | 2 | | 201 NORTH POPLAR ST | 2 | | 201 WEST 8TH ST | 2 | | 2015 HWY 97 | 2 | | 2015 HWY 97 E | 2 | | 2015 HWY 97 HOBGOOD | 2 | | 2015 NC 97 | 2 | | 201W 8TH ST | 2 | | 2057 HWY 122 | 2 | | 2101 HOBGOOD RD | 2 | | 2118 HWY 122 | 2 | | 2125 HWY 97 | 2 | | 215 THREE OAKS LANE | 2 | | 218 WEST COMMERCE ST | 2 | | 2288 CANNON ROAD | 2 | | 26 NORRIS ROAD | 2 |
|
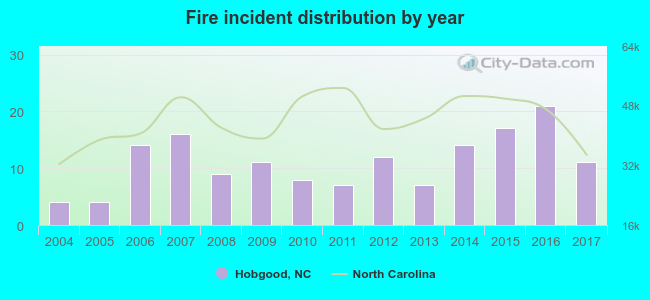 According to the data from the years 2004 - 2017 the average number of fire incidents per year is 11. The highest number of reported fire incidents - 21 took place in 2016, and the least - 4 in 2004. The data has an increasing trend.
 30.3% incidents where reported in the morning and 69.7% in the evening. The most fires (18.1%) took place on Sunday, and the least (9.7%) on Friday.
 According to the 155 incident reports from years 2004 - 2017 most fires (14.2%) took place during September, and the least (4.5%) in November.
 Out of all 279 cases reported during the years 2004 - 2017, the most belonged to the categories: Fire (55.6%), Overpressure Rupture (24.4%), and Service Call (7.2%).
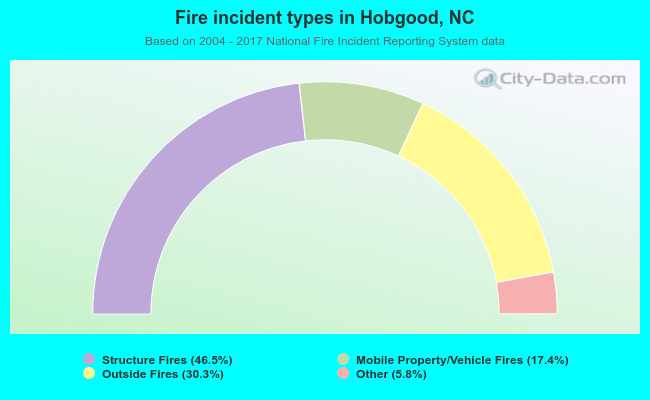 When looking into fire subcategories, the most reports belonged to: Structure Fires (46.5%), and Outside Fires (30.3%).