Hinckley: Fire Incidents, Illinois (IL)
Where are fire incidents reported in Hinckley, IL
Something went wrong! Please refresh the page.
|
| |||||||||||||||||||||||||||||||||||||||||||||||||||||||||||||||||||||||||||||||||||||||||||||||||||||||||||||
2002 - 2018 National Fire Incident Reporting System (NFIRS) incidents
- Incident types reported to NFIRS in Hinckley, IL
- 83160.0%Rescue & EMS
- 25118.1%Fire
- 1249.0%Hazardous Condition
- 604.3%Good Intent Call
- 594.3%Service Call
- 523.8%False Alarm
- 60.4%Severe Weather
- Fire incident types reported to NFIRS in Hinckley, IL
- 11345.0%Outside Fires
- 9839.0%Structure Fires
- 3112.4%Mobile Property/Vehicle Fires
- 93.6%Other
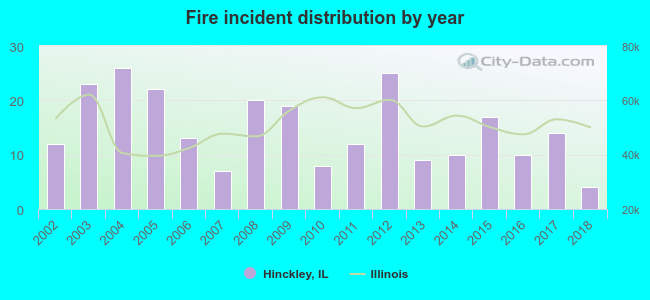 According to the data from the years 2002 - 2018 the average number of fire incidents per year is 15. The highest number of reported fire incidents - 26 took place in 2004, and the least - 4 in 2018. The data has a declining trend.
 31.9% incidents where reported in the morning and 68.1% in the evening. The most fires (20.3%) took place on Monday, and the least (8.4%) on Thursday.
 Based on the 251 reports from years 2002 - 2018 most fires (14.3%) took place during April, and the least (2.8%) in January.
 Out of all 1,384 cases reported during the years 2002 - 2018, the most belonged to the categories: Overpressure Rupture (60.0%), Fire (18.1%), and Rescue & EMS (9.0%).
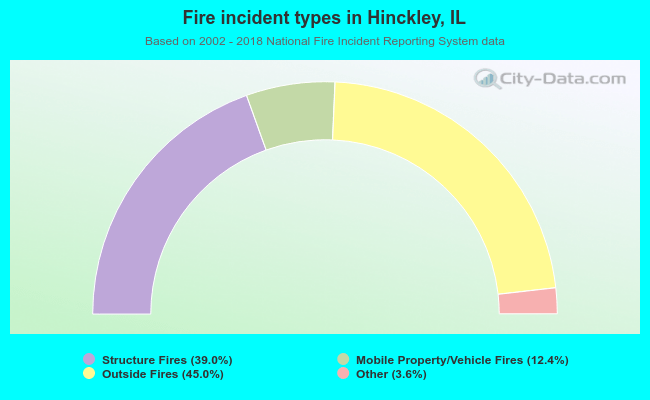 When looking into fire subcategories, the most incidents belonged to: Outside Fires (45.0%), and Structure Fires (39.0%).