Hillsboro: Fire Incidents, Wisconsin (WI)
Where are fire incidents reported in Hillsboro, WI
Something went wrong! Please refresh the page.
|
| |||||||||||||||||||||||||||||||||||||||||||||||||||||||||||||||||||||||||||||||||||||||||||||||||||||||||||||
| Other | 21 | |||||||||||||||||||||||||||||||||||||||||||||||||||||||||||||||||||||||||||||||||||||||||||||||||||||||||||||
2004 - 2018 National Fire Incident Reporting System (NFIRS) incidents
- Incident types reported to NFIRS in Hillsboro, WI
- 31958.7%Fire
- 9016.6%Rescue & EMS
- 7313.4%Hazardous Condition
- 305.5%False Alarm
- 152.8%Good Intent Call
- 112.0%Severe Weather
- 50.9%Service Call
- Fire incident types reported to NFIRS in Hillsboro, WI
- 16451.4%Structure Fires
- 10833.9%Outside Fires
- 268.2%Mobile Property/Vehicle Fires
- 216.6%Other
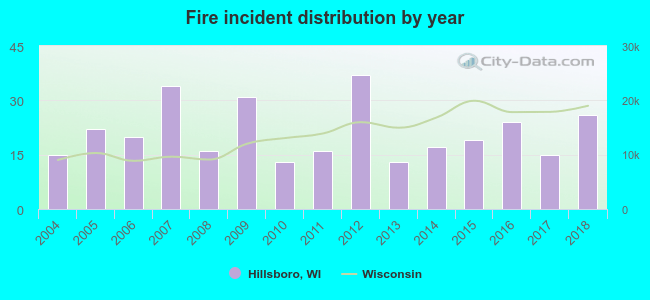 Based on the data from the years 2004 - 2018 the average number of fire incidents per year is 21. The highest number of fires - 37 took place in 2012, and the least - 13 in 2010. The data has an increasing trend.
 39.2% incidents where reported in the morning and 60.8% in the evening. The most fires (18.2%) took place on Monday, and the least (9.4%) on Sunday.
 Based on the 319 reports from years 2004 - 2018 most fires (22.3%) took place during April, and the least (2.5%) in August.
 Out of all 543 cases reported during the years 2004 - 2018, the most belonged to the categories: Fire (58.7%), Overpressure Rupture (16.6%), and Rescue & EMS (13.4%).
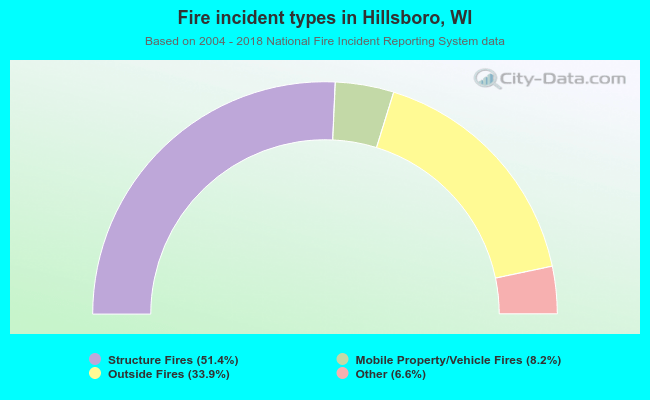 When looking into fire subcategories, the most incidents belonged to: Structure Fires (51.4%), and Outside Fires (33.9%).