Hillrose: Fire Incidents, Colorado (CO)
Where are fire incidents reported in Hillrose, CO
Something went wrong! Please refresh the page.
|
| |||||||||||||||||||||||||||||||||||||||||||||||||||||||||||||||||||||||||||||||||||||||||||||||||||||||||||||
2004 - 2018 National Fire Incident Reporting System (NFIRS) incidents
- Incident types reported to NFIRS in Hillrose, CO
- 13570.7%Fire
- 3417.8%Rescue & EMS
- 105.2%Hazardous Condition
- 105.2%Good Intent Call
- 21.0%False Alarm
- Fire incident types reported to NFIRS in Hillrose, CO
- 9570.4%Outside Fires
- 1914.1%Structure Fires
- 1611.9%Mobile Property/Vehicle Fires
- 53.7%Other
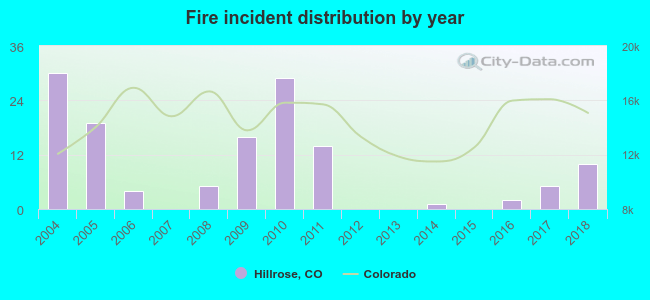 According to the data from the years 2004 - 2018 the average number of fire incidents per year is 9. The highest number of fire incidents - 30 took place in 2004, and the least - 0 in 2007. The data has a decreasing trend.
 10.4% incidents where reported in the morning and 89.6% in the evening. The most fires (20.7%) took place on Tuesday, and the least (8.9%) on Monday.
 Based on the 135 fire incident reports from years 2004 - 2018 most fires (20.7%) took place during March, and the least (0.7%) in January.
 Out of all 191 cases reported during the years 2004 - 2018, the most belonged to the categories: Fire (70.7%), Overpressure Rupture (17.8%), and Rescue & EMS (5.2%).
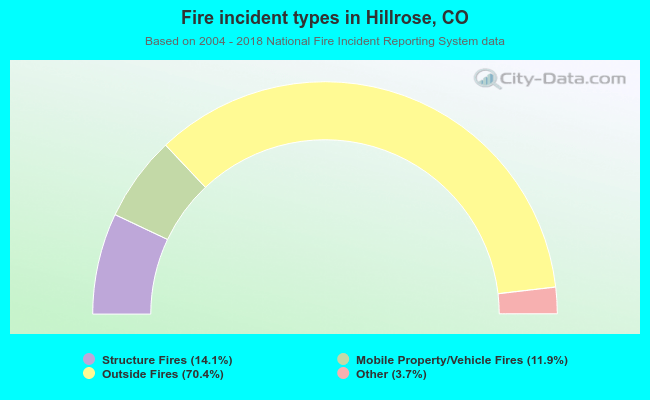 When looking into fire subcategories, the most reports belonged to: Outside Fires (70.4%), and Structure Fires (14.1%).