| Fire incidents reported |
|---|
| Sreet name | Count |
|---|
| CO RD 451 | 22 | | CO RD 459 | 22 | | M32 | 20 | | M-32 | 14 | | CO RD 624 | 12 | | CO RD 628 | 8 | | FARRIER RD | 8 | | PLEASANT VALLEY RD | 8 | | 21140 CO RD 624 | 6 | | COUNTY ROAD 451 | 6 | | KLEIN RD | 6 | | 12343 HUNT ROAD | 4 | | 19235 PLEASANT VALLEY RD | 4 | | 23145 HUNT RD. | 4 | | BELL RD | 4 | | CO RD 452 | 4 | | FARRIER ROAD | 4 | | GAMAGE | 4 | | GROSINSKY RD | 4 | | HASKINS RD | 4 | | HIAWATHA TRAIL | 4 | | JACKS LANDING RD | 4 | | JONES RD | 4 | | LAKE AVALON RD | 4 | | M32 WEST | 4 |
| | | Fire incidents reported |
|---|
| Sreet name | Count |
|---|
| PINE OAKS RD | 4 | | PLEASANT VALLEY | 4 | | PLEASANT VALLEY RD | 4 | | RUPINSKI RD | 4 | | RUPINSKI RD | 4 | | RUST RD | 4 | | TENNIS RD | 4 | | VETERANS MEMORIAL HWY | 4 | | VOYER LAKE RD | 4 | | 10385-10361 RUST RD. | 2 | | 11343 LONG RAPIDS RD. | 2 | | 11370 PLEASANT VALLEY RD | 2 | | 115 STATE ST | 2 | | 118570 RED PINE DR. | 2 | | 121 LYNN ST. | 2 | | 12155 GROSINSKY RD. | 2 | | 12907 PLEASENT VALLEY ROAD | 2 | | 130 MAPLE ST. | 2 | | 131 STATE ST | 2 | | 14650 CLARK ST | 2 | | 14650 CLARK STRE | 2 | | 14685 CHUCKS RD | 2 | | 15545 PINE OAKS | 2 | | 15660 CARTER RD. | 2 | | |
|
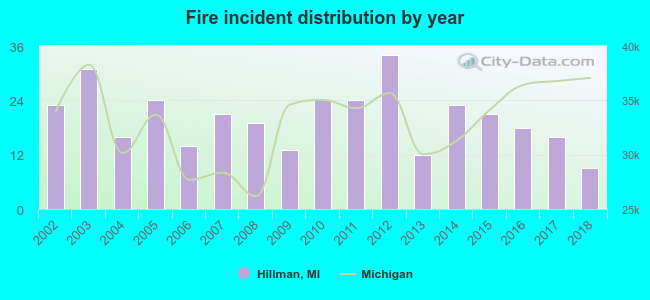 According to the data from the years 2002 - 2018 the average number of fire incidents per year is 20. The highest number of reported fire incidents - 34 took place in 2012, and the least - 9 in 2018. The data has a declining trend.
 28.4% incidents where reported in the morning and 71.6% in the evening. The most fires (18.1%) took place on Thursday, and the least (11.4%) on Monday.
 According to the 342 reports from years 2002 - 2018 most fires (21.3%) took place during April, and the least (3.8%) in September.
 Out of all 669 cases reported during the years 2002 - 2018, the most belonged to the categories: Fire (51.1%), Hazardous Condition (28.1%), and Service Call (7.8%).
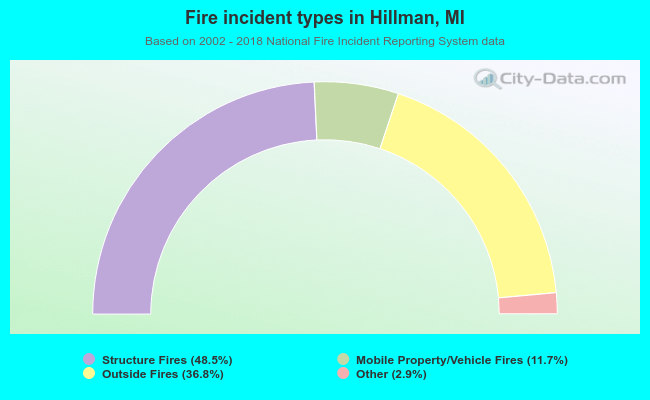 When looking into fire subcategories, the most reports belonged to: Structure Fires (48.5%), and Outside Fires (36.8%).