Hesperia: Fire Incidents, Michigan (MI)
Where are fire incidents reported in Hesperia, MI
Something went wrong! Please refresh the page.
|
| |||||||||||||||||||||||||||||||||||||||||||||||||||||||||||||||||||||||||||||||||||||||||||||||||||||||||||||
2002 - 2018 National Fire Incident Reporting System (NFIRS) incidents
- Incident types reported to NFIRS in Hesperia, MI
- 47751.1%Fire
- 20221.7%Hazardous Condition
- 14115.1%Rescue & EMS
- 586.2%Good Intent Call
- 353.8%False Alarm
- 131.4%Service Call
- 60.6%Special Incident
- 10.1%Overpressure Rupture
- Fire incident types reported to NFIRS in Hesperia, MI
- 26555.6%Structure Fires
- 15031.4%Outside Fires
- 5010.5%Mobile Property/Vehicle Fires
- 122.5%Other
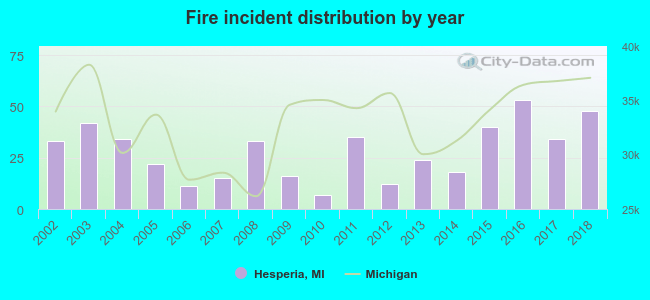 According to the data from the years 2002 - 2018 the average number of fires per year is 28. The highest number of reported fire incidents - 53 took place in 2016, and the least - 7 in 2010. The data has an increasing trend.
 25.8% incidents where reported in the morning and 74.2% in the evening. The most fires (16.4%) took place on Saturday, and the least (12.4%) on Thursday.
 According to the 477 fires from years 2002 - 2018 most fires (20.3%) took place during April, and the least (2.7%) in September.
 Out of all 933 cases reported during the years 2002 - 2018, the most belonged to the categories: Fire (51.1%), Hazardous Condition (21.7%), and Rescue & EMS (15.1%).
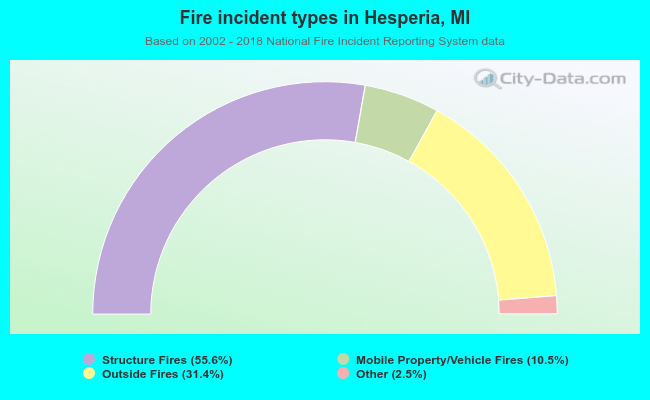 When looking into fire subcategories, the most incidents belonged to: Structure Fires (55.6%), and Outside Fires (31.4%).