Herscher: Fire Incidents, Illinois (IL)
Where are fire incidents reported in Herscher, IL
Something went wrong! Please refresh the page.
|
| |||||||||||||||||||||||||||||||||||||||||||||||||||||||||||||||||||||||||||||||||||||||||||||||||||||||||||||
| Other | 15 | |||||||||||||||||||||||||||||||||||||||||||||||||||||||||||||||||||||||||||||||||||||||||||||||||||||||||||||
2002 - 2018 National Fire Incident Reporting System (NFIRS) incidents
- Incident types reported to NFIRS in Herscher, IL
- 20935.6%Fire
- 13623.2%Rescue & EMS
- 7813.3%Hazardous Condition
- 6210.6%False Alarm
- 579.7%Service Call
- 457.7%Good Intent Call
- Fire incident types reported to NFIRS in Herscher, IL
- 11153.1%Structure Fires
- 6531.1%Outside Fires
- 188.6%Other
- 157.2%Mobile Property/Vehicle Fires
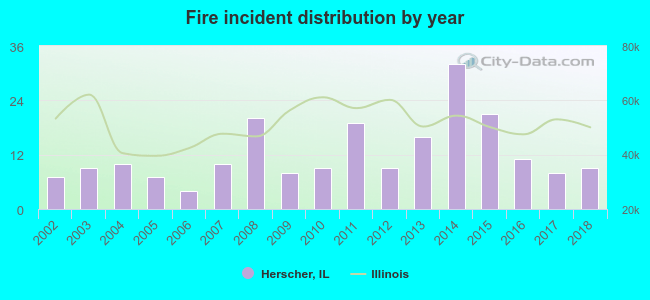 Based on the data from the years 2002 - 2018 the average number of fires per year is 12. The highest number of reported fire incidents - 32 took place in 2014, and the least - 4 in 2006. The data has an increasing trend.
 25.8% incidents where reported in the morning and 74.2% in the evening. The most fires (23.9%) took place on Wednesday, and the least (10.0%) on Monday.
 According to the 209 fire incident reports from years 2002 - 2018 most fires (12.9%) took place during April, and the least (3.3%) in June.
 Out of all 587 cases reported during the years 2002 - 2018, the most belonged to the categories: Fire (35.6%), Overpressure Rupture (23.2%), and Rescue & EMS (13.3%).
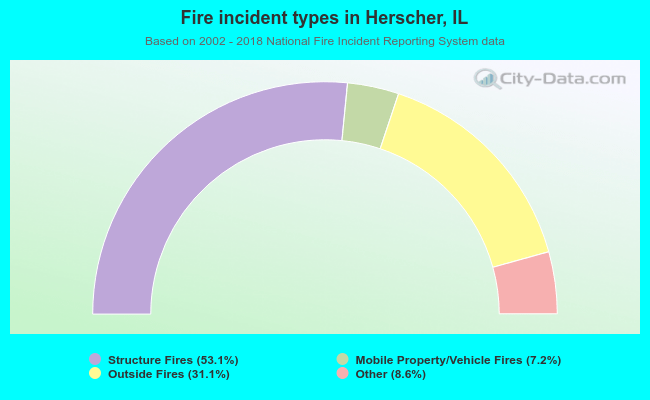 When looking into fire subcategories, the most reports belonged to: Structure Fires (53.1%), and Outside Fires (31.1%).