| Fire incidents reported |
|---|
| Sreet name | Count |
|---|
| BOLT AVE | 14 | | ADAMS ST | 10 | | BROADWAY ST | 10 | | EAST ST | 10 | | BROADWAY AVE | 8 | | CR 100 NORTH RD | 8 | | CR 1450 EAST RD | 8 | | CR 3125 NORTH RD | 8 | | CR 600 EAST RD | 8 | | RR#1 | 8 | | 1700 ST | 6 | | CR 1150 EAST RD | 6 | | CR 700 EAST RD | 6 | | FIRST ST | 6 | | 000 N RD | 4 | | 1325 ST | 4 | | 700 EAST RD | 4 | | CR 1300 EAST RD | 4 | | CR 1300 RD | 4 | | CR 1700 EAST RD | 4 | | CR 3050 NORTH RD | 4 | | CR 3100 NORTH RD | 4 | | CR 525 EAST RD | 4 | | NORTH FIRST ST | 4 | | RR 1 | 4 |
| | | Fire incidents reported |
|---|
| Sreet name | Count |
|---|
| RR1 BOX 330 | 4 | | SOUTH ST | 4 | | 0 NORTH RD | 2 | | 1 N 1ST | 2 | | 1 NORTH 1ST STREET | 2 | | 104 NORTH STREET | 2 | | 1052 E 200 NORTH | 2 | | 108 N BOLT | 2 | | 1150E & 3200N | 2 | | 1300E RD | 2 | | 1450 RD | 2 | | 1450 ST | 2 | | 1550TH ST | 2 | | 1626E 32TH AVE | 2 | | 1650 TH AVE 3164 FEYETTE | 2 | | 1650TH ST | 2 | | 1675 E 3100 N FAYETTE CO | 2 | | 1900 E 3140 N RD | 2 | | 190N 600E | 2 | | 200 NORTH RD | 2 | | 201 N BROADWAY | 2 | | 204 SOUTH FIRST | 2 | | 204 WEST SOUTH FIRST | 2 | | 211 DEPEW | 2 | | |
|
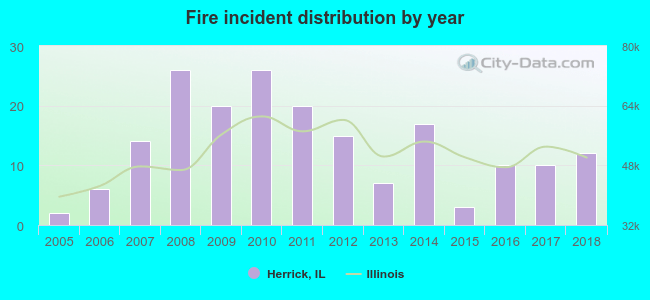 Based on the data from the years 2005 - 2018 the average number of fires per year is 13. The highest number of reported fire incidents - 26 took place in 2008, and the least - 2 in 2005. The data has an increasing trend.
 25.0% incidents where reported in the morning and 75.0% in the evening. The most fires (17.0%) took place on Saturday, and the least (5.9%) on Monday.
 According to the 188 fire incident reports from years 2005 - 2018 most fires (14.9%) took place during March, and the least (3.2%) in August.
 Out of all 445 cases reported during the years 2005 - 2018, the most belonged to the categories: Overpressure Rupture (42.9%), Fire (42.2%), and Rescue & EMS (5.4%).
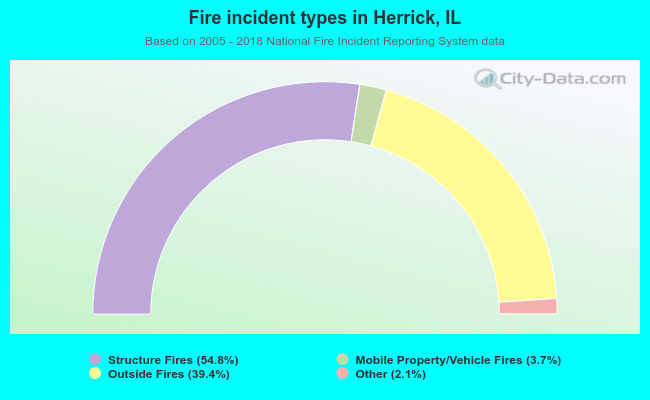 When looking into fire subcategories, the most reports belonged to: Structure Fires (54.8%), and Outside Fires (39.4%).