| Fire incidents reported |
|---|
| Sreet name | Count |
|---|
| STATE RTE. 71 | 24 | | POWER PLANT ROAD | 10 | | 800TH | 8 | | 800TH ST | 8 | | HATTONS RD | 8 | | 850TH | 6 | | COUNTY RD. 800E | 6 | | ESK ST | 6 | | STEEL DRIVE | 6 | | 11TH ST | 4 | | 13230 PRAIRIE INDUSTRIAL PARKW | 4 | | COURT | 4 | | ESK | 4 | | HENNEPIN FARMS ROAD | 4 | | HENNEPIN FLORID RD | 4 | | HIGH | 4 | | IL HWY 26 | 4 | | POWER PLANT RD | 4 | | POWER PLANT RD | 4 | | STEEL DR | 4 | | 10TH | 2 | | 112 S. ELEVENTH ST. | 2 | | 1150 TH AVE | 2 | | 13230 PRAIRIE INDUSTRIAL PARKY | 2 | | 1400 AVE | 2 |
| | | Fire incidents reported |
|---|
| Sreet name | Count |
|---|
| 4TH STREET | 2 | | 600 AVE | 2 | | 6380 IL HWY 26 | 2 | | 675TH AVE | 2 | | 7986 HENNEPIN FARMS | 2 | | 800 ST | 2 | | 8385 URNIKIS DRIVE | 2 | | 850TH AVENUE | 2 | | 9286 E POWERPLANT ROAD | 2 | | 9562 HENNEPIN FLORID ROAD | 2 | | DORE DR | 2 | | ESK ROAD | 2 | | HATTONS ROAD | 2 | | HENNEPIN DRAINAGE | 2 | | HENNEPIN FARMS RD | 2 | | HENNEPIN FLORID | 2 | | HENNEPINFLORID RD | 2 | | HOLMES ROAD | 2 | | IL 26 | 2 | | IL HWY 71 | 2 | | IL ROUTE 26 | 2 | | ILLINOIS HWY 26 HWY | 2 | | INTERSTATE 80 | 2 | | MARKET | 2 | | |
|
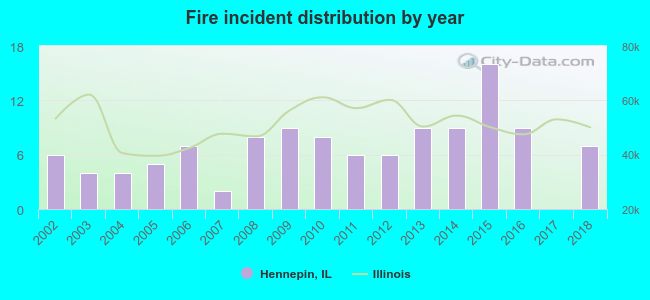 Based on the data from the years 2002 - 2018 the average number of fires per year is 7. The highest number of reported fire incidents - 16 took place in 2015, and the least - 0 in 2017. The data has an increasing trend.
 38.3% incidents where reported in the morning and 61.7% in the evening. The most fires (22.6%) took place on Tuesday, and the least (7.0%) on Thursday.
 According to the 115 fire incident reports from years 2002 - 2018 most fires (14.8%) took place during June, and the least (3.5%) in November.
 Out of all 231 cases reported during the years 2002 - 2018, the most belonged to the categories: Fire (49.8%), Rescue & EMS (24.7%), and Hazardous Condition (8.2%).
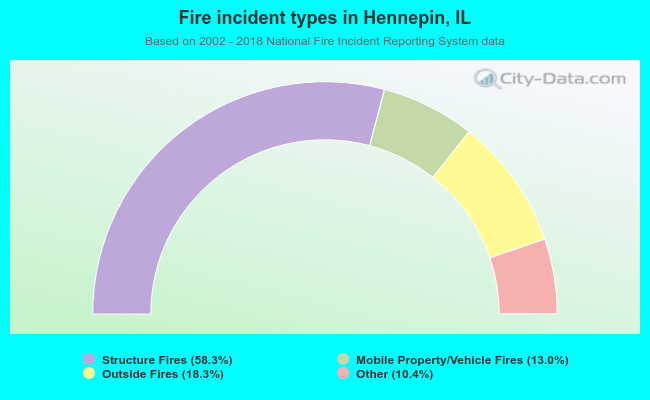 When looking into fire subcategories, the most reports belonged to: Structure Fires (58.3%), and Outside Fires (18.3%).