| Fire incidents reported |
|---|
| Sreet name | Count |
|---|
| MOUNTAIN RD | 24 | | GOOD SPRING RD | 12 | | MAIN ST | 12 | | BROOK (13) ST | 8 | | MOUNTAIN13 RD | 8 | | GOOD SPRING (13) RD | 6 | | LUDWIG LANE | 6 | | MAIN ST | 6 | | MOUNTAIN ROAD | 6 | | CHESTNUT (13) ST | 4 | | DEEP CREEK (13) RD | 4 | | EAST MOUNTAIN ROAD | 4 | | GROVE13 DR | 4 | | HILL (01) RD | 4 | | HILL (13) RD | 4 | | LUDWIG01 LA | 4 | | MOUNTAIN (13) RD | 4 | | MOUNTAIN RD | 4 | | 929 E MOUNTAIN ROAD | 2 | | BARNES (13) RD | 2 | | BARNES LANE LA | 2 | | BROOK ST | 2 | | CHESTNUT ST | 2 | | COLEMAN RD | 2 | | DEEP CREEK RD | 2 |
| | | Fire incidents reported |
|---|
| Sreet name | Count |
|---|
| DEEP CREEK RD | 2 | | EAST MAIN STREET | 2 | | EAST MOUNTAIN RD | 2 | | EAST MTN RD | 2 | | ELSIE | 2 | | FARM (13) LA | 2 | | FOUNTAIN (13) RD | 2 | | GAP (13) ST | 2 | | GAP VIEW RD | 2 | | GOODSPRING RD | 2 | | GROVE | 2 | | GROVE (13) DR | 2 | | GROVE DRIVE | 2 | | HILL RD | 2 | | HINKLE | 2 | | KLINGER (01) LA | 2 | | KLINGER (13) RD | 2 | | MAIN (13) ST | 2 | | MAINT ST | 2 | | MAPLE RD. | 2 | | MAPLEWOOD (01) RD | 2 | | MOUNTAIN | 2 | | OLD MILL (13) RD | 2 | | PINE DRIVE | 2 | | POPLAR ST | 2 |
|
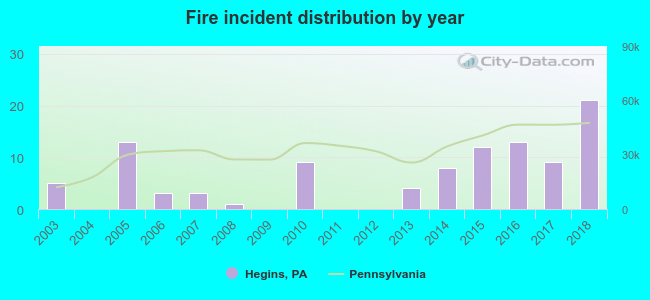 Based on the data from the years 2003 - 2018 the average number of fires per year is 6. The highest number of fire incidents - 21 took place in 2018, and the least - 0 in 2004. The data has a growing trend.
 32.7% incidents where reported in the morning and 67.3% in the evening. The most fires (23.8%) took place on Monday, and the least (7.9%) on Wednesday.
 According to the 101 fire incidents from years 2003 - 2018 most fires (17.8%) took place during April, and the least (1.0%) in June.
 Out of all 285 cases reported during the years 2003 - 2018, the most belonged to the categories: Fire (35.4%), Rescue & EMS (21.1%), and Service Call (16.8%).
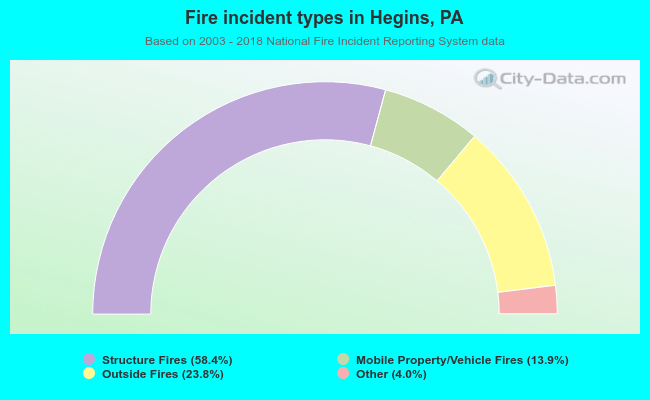 When looking into fire subcategories, the most incidents belonged to: Structure Fires (58.4%), and Outside Fires (23.8%).