| Fire incidents reported |
|---|
| Sreet name | Count |
|---|
| HWY 80 | 16 | | BADGER RD | 10 | | HWY 11 | 10 | | ROCK CUT RD | 10 | | 11 HWY | 6 | | BADGER ROAD | 6 | | PARK LANE | 6 | | COUNTY Z HWY | 4 | | DEVON ROAD | 4 | | FAIRPLAY RD | 4 | | FAIRPLAY ST | 4 | | FRONTAGE RD | 4 | | HIGHWAY 80 | 4 | | HILL RD | 4 | | HWY 35 | 4 | | HYVIEW RD | 4 | | LOGAN RD | 4 | | PERCIVAL ST | 4 | | SANDY HOOK RD | 4 | | YORK ROAD | 4 | | 1015 SOUTH PERCIVAL STREET | 2 | | 1148 BADGER RD | 2 | | 1296 SINSINAWA RD | 2 | | 1305 SOUTH PERICAL | 2 | | 1354 BLUFF RD | 2 |
| | | Fire incidents reported |
|---|
| Sreet name | Count |
|---|
| 13TH STREET | 2 | | 14 STREET | 2 | | 1410 21TH STREET | 2 | | 1491 HWY 80 | 2 | | 151 61 HWY | 2 | | 1515 26TH STREET | 2 | | 1540 CHURCH ROAD | 2 | | 1540 YORK ROAD | 2 | | 15TH STREET | 2 | | 1671 PLUM HOLLOW RD | 2 | | 170 HWY 35 | 2 | | 1763 BLUFF RD | 2 | | 1790 FRANKLIN LANE | 2 | | 1908 SINSINAWA RD. | 2 | | 2358 KENNEDY RD | 2 | | 2511 KENNEDY RD | 2 | | 2551 CTY HWY Z | 2 | | 28758 CTY W | 2 | | 2881 HWY 11 | 2 | | 30792 BUNCOMBE RD | 2 | | 3116 SANDY HOOK RD | 2 | | 3116 SANDY HOOK ROAD | 2 | | 3510 SANDY HOOK RD | 2 | | 4003 SANDY HOOK RD | 2 | | |
|
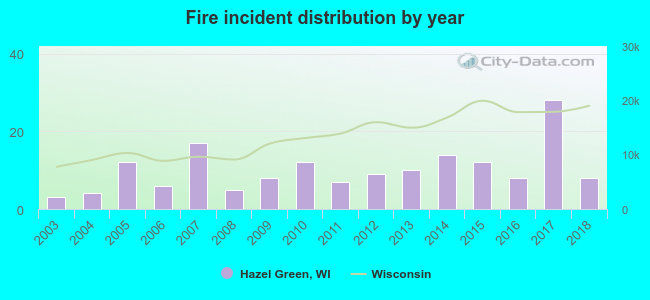 Based on the data from the years 2003 - 2018 the average number of fire incidents per year is 10. The highest number of fires - 28 took place in 2017, and the least - 3 in 2003. The data has an increasing trend.
 28.2% incidents where reported in the morning and 71.8% in the evening. The most fires (20.2%) took place on Wednesday, and the least (9.2%) on Monday.
 Based on the 163 reports from years 2003 - 2018 most fires (14.1%) took place during April, and the least (4.9%) in January.
 Out of all 489 cases reported during the years 2003 - 2018, the most belonged to the categories: Rescue & EMS (42.5%), Fire (33.3%), and Hazardous Condition (8.0%).
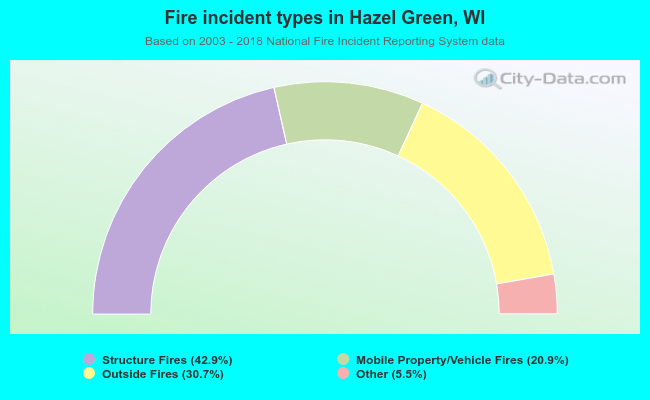 When looking into fire subcategories, the most incidents belonged to: Structure Fires (42.9%), and Outside Fires (30.7%).