| Fire incidents reported |
|---|
| Sreet name | Count |
|---|
| HWY 63 | 12 | | STH 77 HWY | 10 | | HWY 77 | 8 | | HWY 63 SOUTH | 6 | | OLKER RD | 6 | | SCHOOL HOUSE RD | 6 | | TOWNE VIEW RD | 6 | | USH 63 HWY | 6 | | 10210 TOWNE VIEW RD | 4 | | 10298 LEIN RD | 4 | | 10408 GREENWOOD LN | 4 | | 11679W TWIN LAKES RD | 4 | | 16397 HENK ROAD | 4 | | 3RD ST | 4 | | 77 HWY | 4 | | CIRCLE RD RD | 4 | | COUNTY HILL ROAD | 4 | | COUNTY HWY B | 4 | | COUNTY HWY E HWY | 4 | | CTH B HWY | 4 | | CTH K | 4 | | DAVIS AVE | 4 | | DRYTOWN AVE | 4 | | DRYTOWN AVE AVE | 4 | | FUN VALLEY RD | 4 |
| | | Fire incidents reported |
|---|
| Sreet name | Count |
|---|
| GRAND PINES LN | 4 | | HOSPITAL ROAD | 4 | | HWY 63 HWY | 4 | | HWY 77 EAST | 4 | | HWY K | 4 | | LAKE AVE EAST AVE | 4 | | LEE ROAD | 4 | | LEIN RD | 4 | | PARK RD | 4 | | PENINSULA ROAD | 4 | | PINE POINT RD | 4 | | PINEWOOD DR | 4 | | STATE HWY 77 | 4 | | TREELAND RD | 4 | | US HWY 63 | 4 | | US HWY 63 HWY | 4 | | W638 COZY ACRES | 4 | | WALMART | 4 | | WATER TOWER LANE | 4 | | 00 HWY | 2 | | 10154 OLKER RD | 2 | | 10235 TOWNVIEW RD | 2 | | 10236 GORNEY RD | 2 | | 10245 OLKER RD | 2 | | |
|
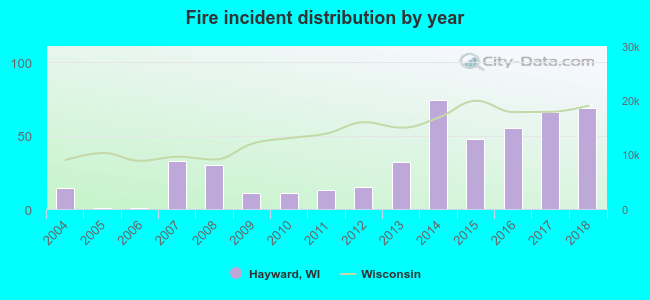 According to the data from the years 2004 - 2018 the average number of fires per year is 32. The highest number of reported fires - 74 took place in 2014, and the least - 1 in 2005. The data has a growing trend.
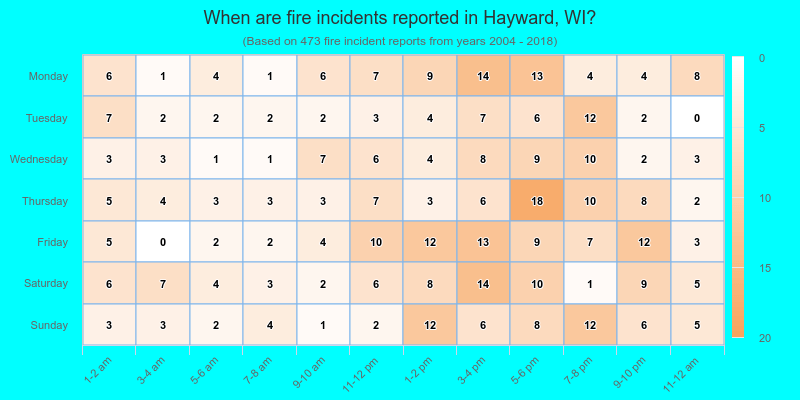
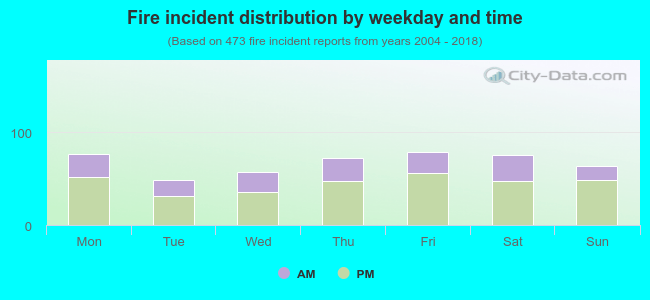 32.8% incidents where reported in the morning and 67.2% in the evening. The most fires (16.7%) took place on Friday, and the least (10.4%) on Tuesday.
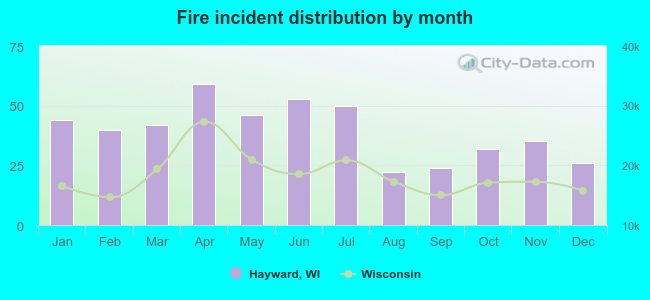 Based on the 473 incident reports from years 2004 - 2018 most fires (12.5%) took place during April, and the least (4.7%) in August.
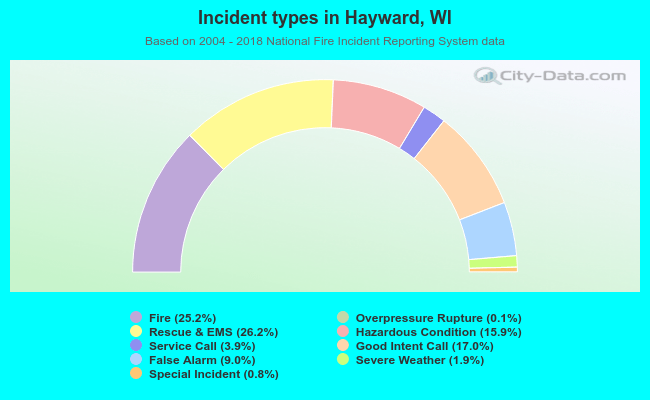 Out of all 1,880 cases reported during the years 2004 - 2018, the most belonged to the categories: Rescue & EMS (26.2%), Fire (25.2%), and Good Intent Call (17.0%).
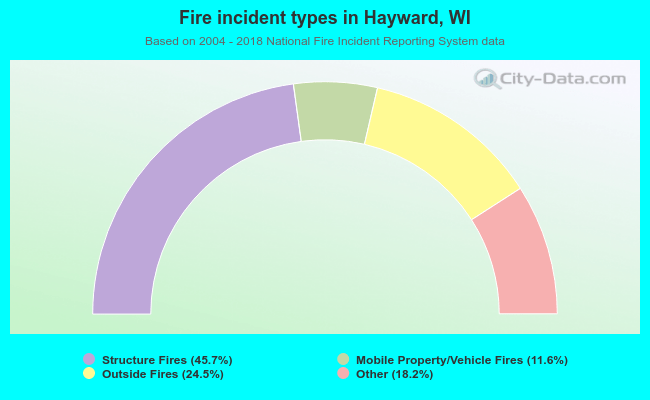 When looking into fire subcategories, the most incidents belonged to: Structure Fires (45.7%), and Outside Fires (24.5%).