| Fire incidents reported |
|---|
| Sreet name | Count |
|---|
| BARTLICK RD | 10 | | BARTLICK RD | 6 | | BIG RIDGE RD | 6 | | BREAKS PARK RD | 6 | | CROOKED BRANCH | 6 | | DICKENSON HWY | 6 | | GREENBRIER RD | 6 | | LITTLE LICK HOLLOW | 6 | | SANDLICK RD | 6 | | BIG RIDGE RD | 4 | | BREAKS PARK RD RD | 4 | | CAUDLE LN | 4 | | CENTENNIAL HEIGHTS RD | 4 | | CENTENNIAL HEIGHTS RD | 4 | | CRISSIE RD | 4 | | DO ROAD | 4 | | DUCKTAIL RD | 4 | | FISH POND RD | 4 | | GREENBRIER ROAD | 4 | | OLD THREE C RD | 4 | | OLD THREE C RD | 4 | | ROAD BR | 4 | | SULLIVAN BR | 4 | | TAN TROUGH BR | 4 | | WELCOME LN | 4 |
| | | Fire incidents reported |
|---|
| Sreet name | Count |
|---|
| WINDING ROAD RD | 4 | | 0WENS BR | 2 | | 100 OWENS BRANCH | 2 | | 1047 WILLIE YATES RD | 2 | | 1236 RHOADS BRANCH | 2 | | 126 SYKES LN | 2 | | 1398 LITTLE LICK HOLLOW | 2 | | 166 SIDS LANE | 2 | | 196 TUNNER CIRCLE | 2 | | 252 RETREAT HILL | 2 | | 269 ARRONS DR | 2 | | 319 RAKES RIDGE RD | 2 | | 3365 BACKBONE RIDGE | 2 | | 3373 RUSSELL FORK RIVER ROAD | 2 | | 366 HACKNEY RIDGE | 2 | | 376 MOUNT OLIVE LANE | 2 | | 429 DRIFTWOOD LN | 2 | | 489 SNOWDA LN | 2 | | 513 BARTLICK RD | 2 | | 5389 BREAKS PARK RD | 2 | | 5677 BARTLICK RD | 2 | | 6134 LICK CREEK RD | 2 | | 6159 BIG RIDGE RD | 2 | | 6159 BIG RIDGE RD | 2 | | |
|
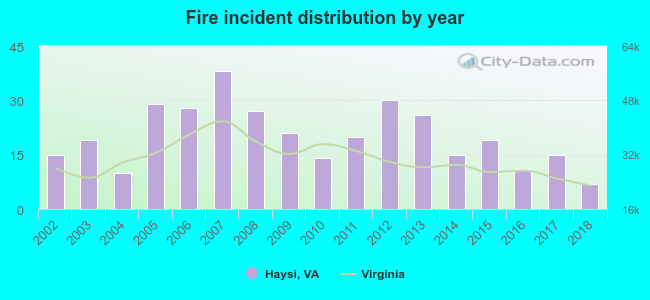 Based on the data from the years 2002 - 2018 the average number of fire incidents per year is 20. The highest number of reported fire incidents - 38 took place in 2007, and the least - 7 in 2018. The data has a declining trend.
 31.4% incidents where reported in the morning and 68.6% in the evening. The most fires (17.7%) took place on Thursday, and the least (11.9%) on Saturday.
 Based on the 344 incident reports from years 2002 - 2018 most fires (18.3%) took place during March, and the least (2.9%) in October.
 Out of all 711 cases reported during the years 2002 - 2018, the most belonged to the categories: Fire (48.4%), Rescue & EMS (26.9%), and Overpressure Rupture (15.8%).
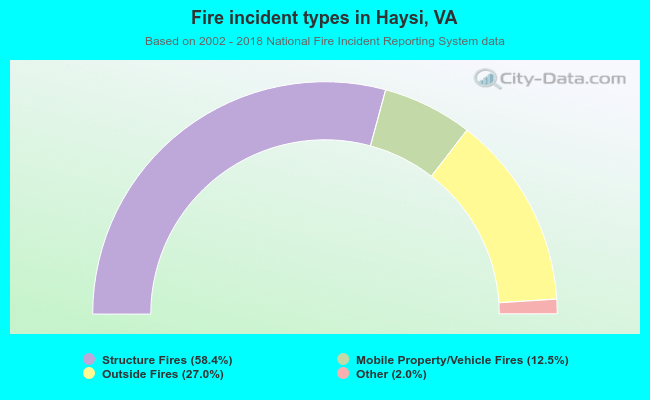 When looking into fire subcategories, the most reports belonged to: Structure Fires (58.4%), and Outside Fires (27.0%).