| Fire incidents reported |
|---|
| Sreet name | Count |
|---|
| 57881 CO RD H | 12 | | 18829 CR 95 | 4 | | CO RD 89 & CO RD 30 | 4 | | COUNTY ROAD | 4 | | 05514 CO RD 28 RD | 2 | | 1/2 NORTH CR 32 AND CR 59 | 2 | | 101 S JOE | 2 | | 106 S WASHINGTON | 2 | | 122 N LAVA ST | 2 | | 12350 CO RD 11 | 2 | | 124 W BRYAN | 2 | | 130 WARSINTON AVE HWY | 2 | | 136 S MILLER | 2 | | 138 N LAVA AVE | 2 | | 14426 CO RD 7 | 2 | | 15758 CO RD 95 | 2 | | 18829 CO RD 95 | 2 | | 19643 CO RD 91 | 2 | | 202 S COLORADO AVE | 2 | | 20280 CO RD 7 | 2 | | 20412 CO RD 11 | 2 | | 20472 CO RD 11 | 2 | | 20490 CR 95 | 2 | | 229 N LAVA AVE | 2 | | 235 W FLETCHER | 2 |
| | | Fire incidents reported |
|---|
| Sreet name | Count |
|---|
| 236 N WALLACE AVE | 2 | | 2820 HWY 59 | 2 | | 28201 HWY 59 HWY | 2 | | 322 E STROHM ST | 2 | | 3500 HWY 6 | 2 | | 4 MILES SOUTH, 1 WEST OF HAXTU | 2 | | 40586 CO RD 21 | 2 | | 425 E STRHOM | 2 | | 44686 CR 4 | 2 | | 500 WEST FLETCHER ST | 2 | | 529 N COLORADO AVE | 2 | | 58385 HWY 59 | 2 | | 70 CR 21 | 2 | | 7152 CO RD 30 | 2 | | 728 S COLORADO ST | 2 | | 741 S WASHINGTON AVE | 2 | | C RD 11 | 2 | | CO HWY 59 AND YUMA COUNTY ROAD | 2 | | CO RD 11 16 | 2 | | CO RD 11& CO RD 8 | 2 | | CO RD 12 & CO RD 11 | 2 | | CO RD 12 & CO RD 91 | 2 | | CO RD 19 & CO RD 40 | 2 | | CO RD 28 & CO RD 3 | 2 | | |
|
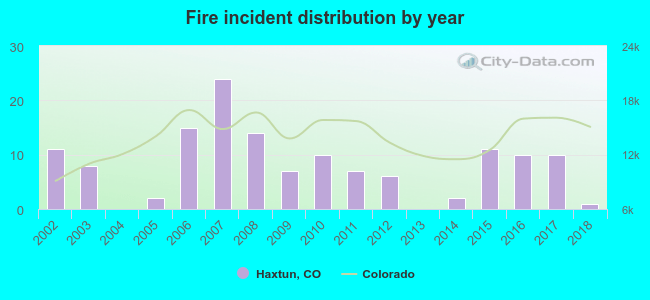 According to the data from the years 2002 - 2018 the average number of fire incidents per year is 8. The highest number of reported fire incidents - 24 took place in 2007, and the least - 0 in 2004. The data has a dropping trend.
 20.3% incidents where reported in the morning and 79.7% in the evening. The most fires (19.6%) took place on Wednesday, and the least (10.1%) on Sunday.
 Based on the 138 fires from years 2002 - 2018 most fires (14.5%) took place during July, and the least (3.6%) in January.
 Out of all 272 cases reported during the years 2002 - 2018, the most belonged to the categories: Fire (50.7%), Rescue & EMS (20.2%), and Overpressure Rupture (11.4%).
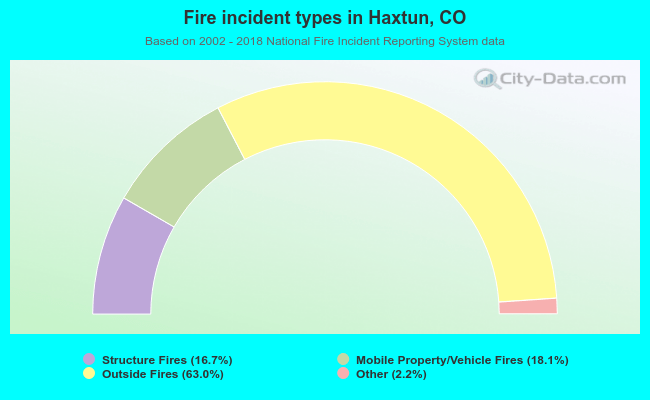 When looking into fire subcategories, the most reports belonged to: Outside Fires (63.0%), and Mobile Property/Vehicle Fires (18.1%).