Hartford: Fire Incidents, Illinois (IL)
Where are fire incidents reported in Hartford, IL
Something went wrong! Please refresh the page.
|
| |||||||||||||||||||||||||||||||||||||||||||||||||||||||||||||||||||||||||||||||||||||||||||||||||||||||||||||
2002 - 2018 National Fire Incident Reporting System (NFIRS) incidents
- Incident types reported to NFIRS in Hartford, IL
- 77961.3%Rescue & EMS
- 21116.6%Fire
- 15712.4%Hazardous Condition
- 524.1%Good Intent Call
- 372.9%Service Call
- 322.5%False Alarm
- Fire incident types reported to NFIRS in Hartford, IL
- 9444.5%Structure Fires
- 5425.6%Outside Fires
- 3918.5%Mobile Property/Vehicle Fires
- 2411.4%Other
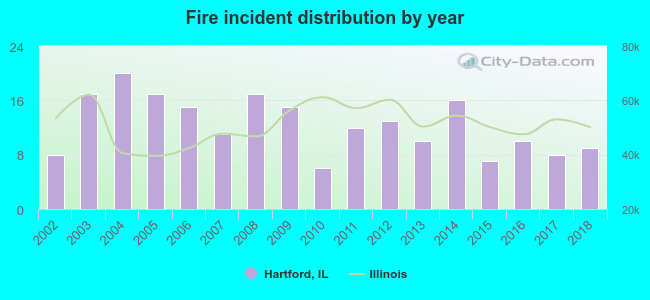 According to the data from the years 2002 - 2018 the average number of fire incidents per year is 12. The highest number of reported fires - 20 took place in 2004, and the least - 6 in 2010. The data has a rising trend.
 37.0% incidents where reported in the morning and 63.0% in the evening. The most fires (19.9%) took place on Tuesday, and the least (11.4%) on Saturday.
 According to the 211 incident reports from years 2002 - 2018 most fires (15.2%) took place during March, and the least (2.8%) in September.
 Out of all 1,270 cases reported during the years 2002 - 2018, the most belonged to the categories: Rescue & EMS (61.3%), Fire (16.6%), and Hazardous Condition (12.4%).
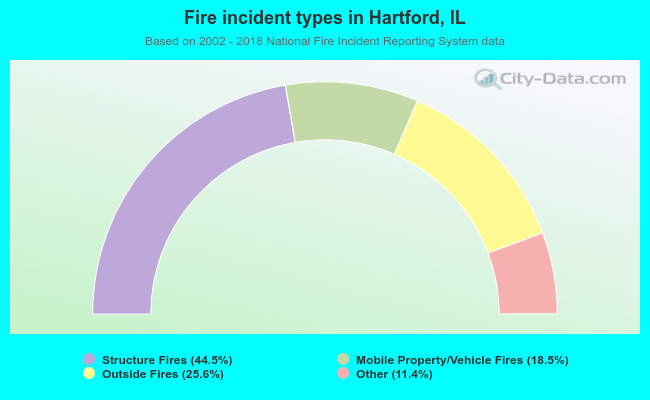 When looking into fire subcategories, the most reports belonged to: Structure Fires (44.5%), and Outside Fires (25.6%).