Harrisville: Fire Incidents, Michigan (MI)
Where are fire incidents reported in Harrisville, MI
Something went wrong! Please refresh the page.
|
| |||||||||||||||||||||||||||||||||||||||||||||||||||||||||||||||||||||||||||||||||||||||||||||||||||||||||||||
2002 - 2018 National Fire Incident Reporting System (NFIRS) incidents
- Incident types reported to NFIRS in Harrisville, MI
- 16742.6%Hazardous Condition
- 16241.3%Fire
- 358.9%Rescue & EMS
- 184.6%False Alarm
- 92.3%Good Intent Call
- 10.3%Service Call
- Fire incident types reported to NFIRS in Harrisville, MI
- 7244.4%Structure Fires
- 6741.4%Outside Fires
- 1811.1%Mobile Property/Vehicle Fires
- 53.1%Other
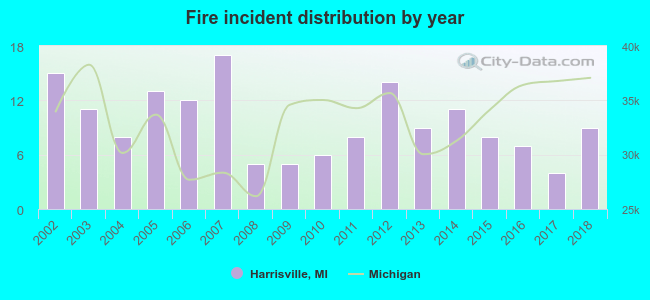 Based on the data from the years 2002 - 2018 the average number of fires per year is 10. The highest number of fire incidents - 17 took place in 2007, and the least - 4 in 2017. The data has a declining trend.
 31.5% incidents where reported in the morning and 68.5% in the evening. The most fires (19.8%) took place on Sunday, and the least (8.6%) on Friday.
 According to the 162 incident reports from years 2002 - 2018 most fires (14.8%) took place during April, and the least (3.1%) in February.
 Out of all 392 cases reported during the years 2002 - 2018, the most belonged to the categories: Rescue & EMS (42.6%), Fire (41.3%), and Overpressure Rupture (8.9%).
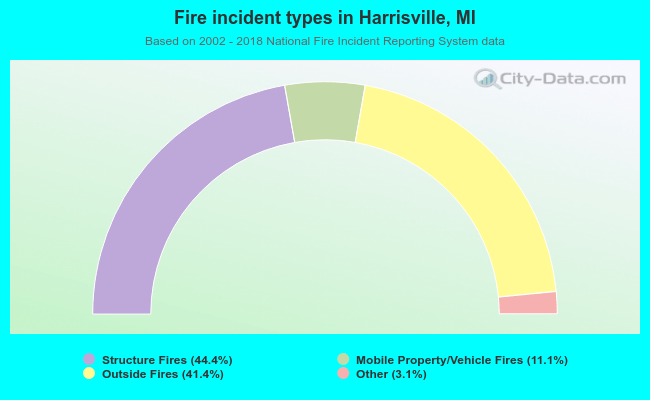 When looking into fire subcategories, the most incidents belonged to: Structure Fires (44.4%), and Outside Fires (41.4%).