| Fire incidents reported |
|---|
| Sreet name | Count |
|---|
| HIGHLANDS PIKE RD | 6 | | WEST CONWAY LANE | 6 | | 2/5470 OSBORNE RD | 4 | | ARBOR STREET KIWANIS PARK | 4 | | FISHER ROAD | 4 | | HIGHLANDS PIKE | 4 | | MAIN ST. | 4 | | MOELLER DR | 4 | | PARK WAY CONWAY COMMONS | 4 | | WEST CONWAY ROAD | 4 | | 01/3901 FIVE MILE CREEK | 2 | | 03/5948 W LEVERING RD | 2 | | 1/2018 WELSHEIMER | 2 | | 1/22 LAMKIN | 2 | | 1/2888 S STATE RD | 2 | | 1/2999 S BEACON | 2 | | 1/3000 S STATE | 2 | | 1/3397 TERPENING RD | 2 | | 1/5151 W STUTSMANVILLE | 2 | | 1/5321 HURD RD | 2 | | 1/7962 W STUTSMANVILLE | 2 | | 1/8685 W STUTSMANVILLE RD | 2 | | 1/8735 STUTSMANVILLE | 2 | | 1/8750 STUTSMANVILLE | 2 | | 1/CETAS AND MIDDLE RD | 2 |
| | | Fire incidents reported |
|---|
| Sreet name | Count |
|---|
| 1/HURD/STATE RD | 2 | | 1200 N LAKE SHORE DR | 2 | | 1219 S. PLEASENTVIEW RD | 2 | | 1999 MELODY LN | 2 | | 2/1075 N LAKE SHORE DR | 2 | | 2/1262 CHUCH RD | 2 | | 2/1875 TOWNLINE | 2 | | 2/2525 N STATE | 2 | | 2/4020 BECKON RD | 2 | | 2/7125 PIKE RD | 2 | | 2/DIVISION RD &GULLY | 2 | | 2/STATE / ROBINSON | 2 | | 2500 TRUE NORTH DRIVE | 2 | | 2825 S LAKE SHORE DR | 2 | | 2874 S STATE RD | 2 | | 2983 STATE ROAD | 2 | | 3/4880 W ROBINSON RD | 2 | | 3/4900 W LEVERING RD | 2 | | 3/6087 N LAKE SHORE DR | 2 | | 3/6201 WATERFRONT DR | 2 | | 3/6737 N LAKE SHORE DR | 2 | | 3/6933 N LAKE SHORE DR | 2 | | 3986 W LEVERING RD | 2 | | 4036 LAKE SHORE DR | 2 | | |
|
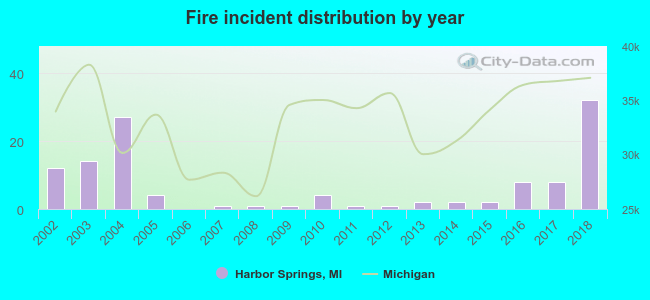 Based on the data from the years 2002 - 2018 the average number of fires per year is 7. The highest number of fire incidents - 32 took place in 2018, and the least - 0 in 2006. The data has a rising trend.
 29.2% incidents where reported in the morning and 70.8% in the evening. The most fires (17.5%) took place on Friday, and the least (7.5%) on Wednesday.
 According to the 120 incident reports from years 2002 - 2018 most fires (12.5%) took place during March, and the least (5.0%) in October.
 Out of all 568 cases reported during the years 2002 - 2018, the most belonged to the categories: Rescue & EMS (32.6%), Fire (21.1%), and Hazardous Condition (16.0%).
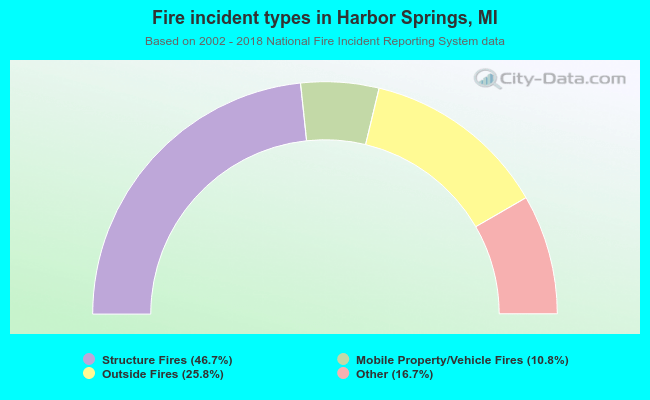 When looking into fire subcategories, the most incidents belonged to: Structure Fires (46.7%), and Outside Fires (25.8%).