| Fire incidents reported |
|---|
| Sreet name | Count |
|---|
| KUHIO HWY | 24 | | HEHI RD | 18 | | HANAMAULU RD | 16 | | LAUKONA ST | 16 | | HANAMAULU BEACH | 14 | | KAPULE HWY | 8 | | HOOHANA ST | 6 | | KALEPA CIR | 6 | | OPUKEA ST | 6 | | PALIKEA ST | 6 | | HANAMAULU BEACH PARK | 4 | | HOOHUKI ST | 4 | | HOOLEPE ST | 4 | | LAWEHANA ST | 4 | | MANULELE ST | 4 | | WAIAHI ST | 4 | | ACROSS KAUAI HILTON | 2 | | AMO ST | 2 | | BEHIND PALANI RD | 2 | | HANAMAULU BAY | 2 | | HANAMAULU BCH | 2 | | HANAMAULU BEACH PARK RD | 2 | | HANAMAULU BEACH RD | 2 | | HANAMAULU BEACH VIC. YELLOW GA | 2 | | HANAMAULU BRIDG | 2 |
| | | Fire incidents reported |
|---|
| Sreet name | Count |
|---|
| HANAMAULU BRIDGE | 2 | | HANAMAULU/KAPULE BRI | 2 | | HEHI | 2 | | HOOHANA | 2 | | HOOHUKI PL | 2 | | HULEI RD | 2 | | KALEPA RIDGE | 2 | | KAUAI BEACH DRIVE | 2 | | KUHIO HWY ACROSS OF | 2 | | KUHIO HWY, NORTH OF KAPULE BRI | 2 | | KUHIO RD | 2 | | LAUKONA STREET | 2 | | LAULIMA RD | 2 | | LUHINA ST | 2 | | MA'ALO RD | 2 | | MANULELE | 2 | | NORTH OF KUHIO / KAP | 2 | | PAIKEA ST | 2 | | PAKA ST | 2 | | PAKAWELI ST | 2 | | POHINA | 2 | | WAIAHI ST. | 2 | | WAILUA FALLS | 2 | | WAILUA GOLF COU | 2 | | |
|
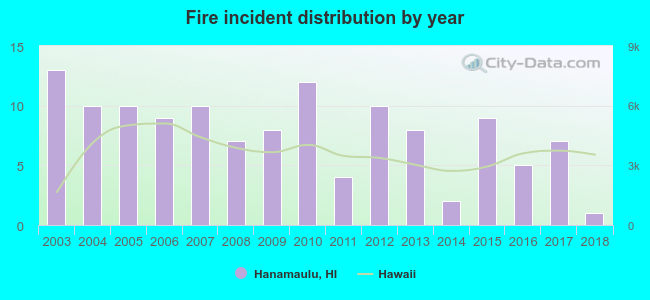 According to the data from the years 2003 - 2018 the average number of fires per year is 8. The highest number of reported fires - 13 took place in 2003, and the least - 1 in 2018. The data has a dropping trend.
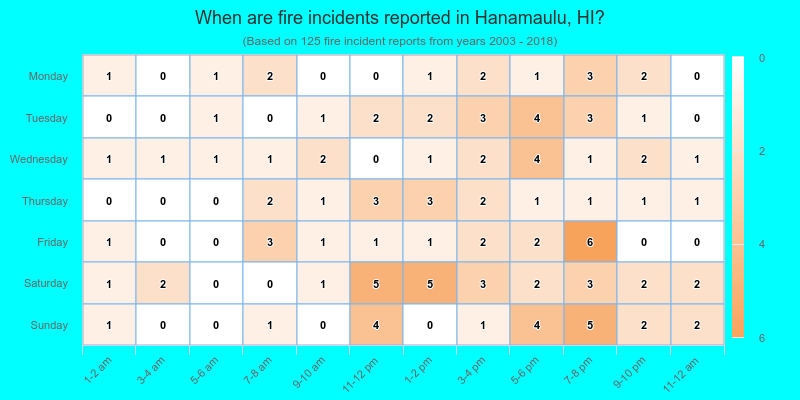
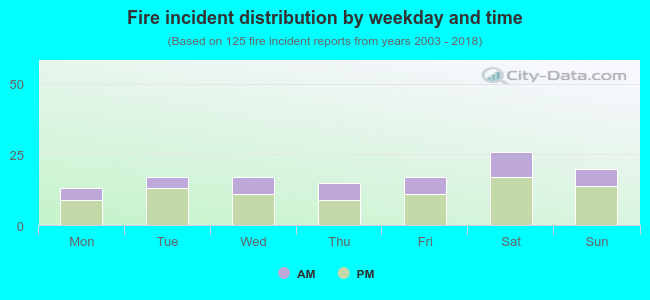 32.8% incidents where reported in the morning and 67.2% in the evening. The most fires (20.8%) took place on Saturday, and the least (10.4%) on Monday.
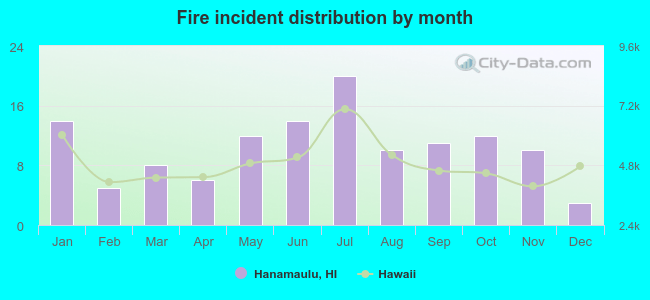 Based on the 125 fire incident reports from years 2003 - 2018 most fires (16.0%) took place during July, and the least (2.4%) in December.
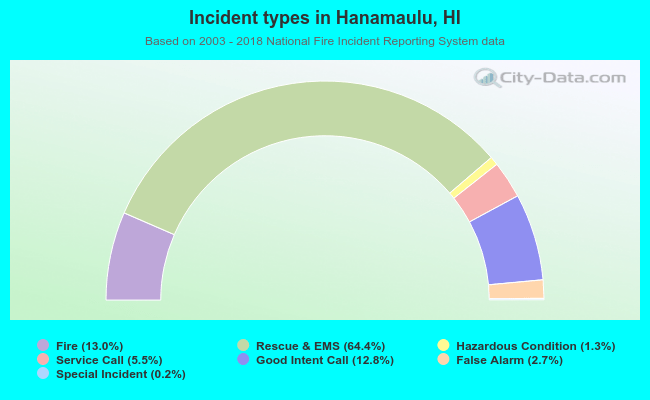 Out of all 959 cases reported during the years 2003 - 2018, the most belonged to the categories: Overpressure Rupture (64.4%), Fire (13.0%), and Service Call (12.8%).
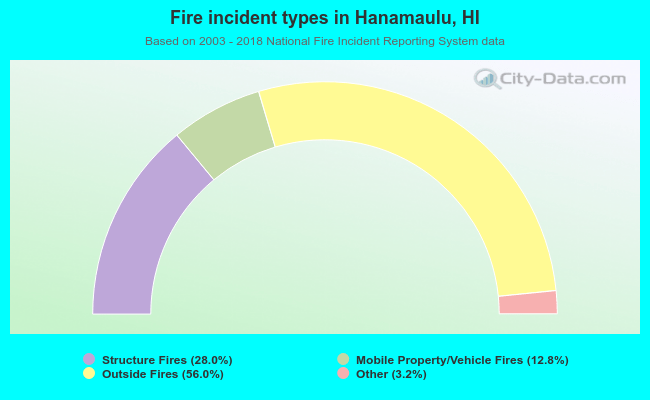 When looking into fire subcategories, the most incidents belonged to: Outside Fires (56.0%), and Structure Fires (28.0%).