| Fire incidents reported |
|---|
| Sreet name | Count |
|---|
| 10365 WEBB LN | 10 | | 6881 SW 89TH ST | 6 | | 8973 SW CR 18 | 6 | | 9121 SE 51ST AVE | 6 | | 9707 US HWY 301 | 6 | | 9890 SE CR 325 | 6 | | CR 325 | 6 | | SW CR 18 | 6 | | 10477 PINELAND DR | 4 | | 10486 SW CR 18 | 4 | | 36TH AVE | 4 | | 5427 HAMPTON VILLAS DR | 4 | | 6305 SE 95TH ST | 4 | | 6862 SW 96TH ST | 4 | | 8358 SE CR 325 | 4 | | 8898 SE CR 325 | 4 | | 9033 SW CR 18 | 4 | | 9338 SE CR 325 | 4 | | 9919 SW 105TH ST | 4 | | 9926 PROSPECT AVE | 4 | | SE 73RD ST | 4 | | SE CR 18 | 4 | | SE CR 18 SANTA FE SWAMP | 4 | | 10012 SW 80TH PL | 2 | | 10012 SW 80TH PLACE | 2 |
| | | Fire incidents reported |
|---|
| Sreet name | Count |
|---|
| 10124 SE 61ST AVE | 2 | | 10183 SW 104 AV | 2 | | 10183 SW 104TH AVENUE | 2 | | 10239 SW 80TH PLACE | 2 | | 10270 US HIGHWAY 301 SOUTH | 2 | | 10270 US HW 301 SOUTH | 2 | | 10291 WEBB LN | 2 | | 10356 US HWY 301 | 2 | | 10365 WEBB LANE | 2 | | 10398 SOUTH US 301 | 2 | | 104 TH AVE X CR 18 | 2 | | 10417 PINELAND DR | 2 | | 10438 US HWY 301 | 2 | | 10555 SE 49TH AVE | 2 | | 10641 SWCR 8 | 2 | | 10721 SW 73RD AVE | 2 | | 10763 SE 49TH AVE | 2 | | 10795 US HIGHWAY 301 | 2 | | 10903 US HWY 301 | 2 | | 1100 SE 101ST WAY | 2 | | 12359 SW 79TH AVE | 2 | | 12542 US HWY 301 | 2 | | 12800 US HWY 301 | 2 | | 13712 SW 98TH AVE | 2 | | 13732 SW 98AVE | 2 |
|
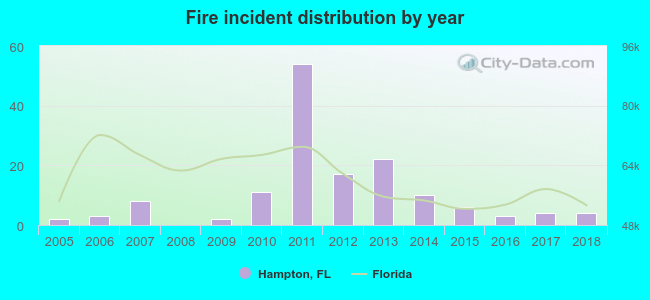 Based on the data from the years 2005 - 2018 the average number of fires per year is 10. The highest number of fires - 54 took place in 2011, and the least - 0 in 2008. The data has a growing trend.
 11.6% incidents where reported in the morning and 88.4% in the evening. The most fires (19.2%) took place on Monday, and the least (11.0%) on Wednesday.
 Based on the 146 fire incidents from years 2005 - 2018 most fires (13.7%) took place during January, and the least (0.7%) in December.
 Out of all 569 cases reported during the years 2005 - 2018, the most belonged to the categories: Overpressure Rupture (50.3%), Fire (25.7%), and Service Call (11.1%).
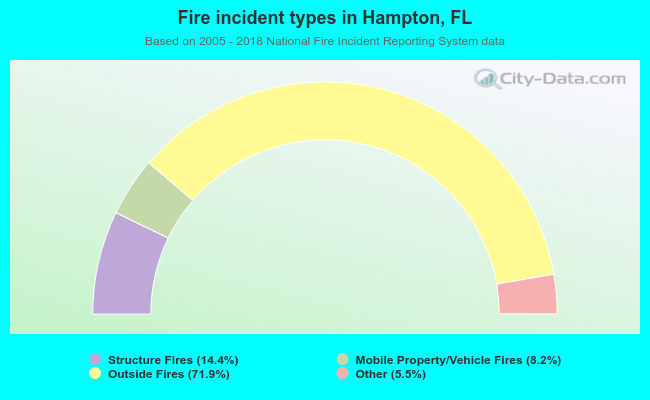 When looking into fire subcategories, the most incidents belonged to: Outside Fires (71.9%), and Structure Fires (14.4%).