| Fire incidents reported |
|---|
| Sreet name | Count |
|---|
| HWY 278 | 16 | | HWY 278 WEST | 12 | | HWY 167 SOUTH | 8 | | HWY 274 | 8 | | 167 SOUTH | 6 | | 2226 CALHOUN 146 | 6 | | HWY 167 | 6 | | HWY 167 N | 6 | | HWY 172 | 6 | | 3028 CALHOUN 235 | 4 | | 4TH AND COLLEGE | 4 | | CALHOUN 19 | 4 | | CALHOUN COUNTY RD 116 | 4 | | HIGHWAY 274 | 4 | | HWY 167 NORTH | 4 | | RT 2 BOX 229 | 4 | | WOODBERRY | 4 | | # 22 RICKEY ST. | 2 | | 100 BLOCK 10TH STREET | 2 | | 1079 CALHOUN 22 | 2 | | 1079 CALHOUN 231 | 2 | | 1099 CALHOUN 19 | 2 | | 1171 W US 278 | 2 | | 123 SOUTH 9TH STREET | 2 | | 12TH ST | 2 |
| | | Fire incidents reported |
|---|
| Sreet name | Count |
|---|
| 138 SMITH ST | 2 | | 1582 HWY 278 W. | 2 | | 160 BRYANTVILLE RD | 2 | | 1662 CALHOUN 27 | 2 | | 167 AND CO RD 89 | 2 | | 167 N. RT 1 BOX 161A | 2 | | 167 NEAR CC RD 27 | 2 | | 167 NORTH RIVER BRIDGE | 2 | | 167 S ON THE DUMP | 2 | | 167 SOUTH 27 CALHOUN | 2 | | 168 SMITH ST | 2 | | 1737 CALHOUN 8 | 2 | | 1801 CALHOUN 24 | 2 | | 196 10TH STREET | 2 | | 199 6TH STREET | 2 | | 203 HUNT ST. | 2 | | 2066 HWY 278 | 2 | | 210 10TH STREET | 2 | | 235 LOCUST STREET | 2 | | 236 MAPLE | 2 | | 2405 HWY 172 | 2 | | 2417 W CALHOUN24 | 2 | | 2469 N US 167 | 2 | | 2525 WEST US HWY 274 | 2 | | |
|
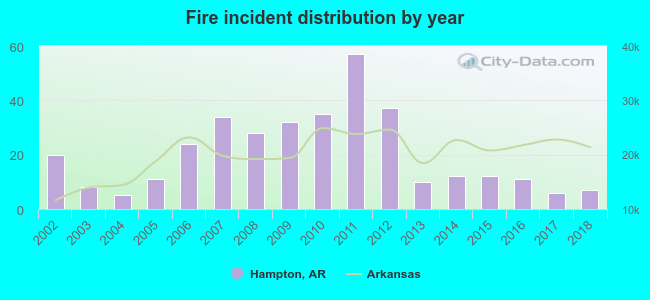 According to the data from the years 2002 - 2018 the average number of fires per year is 21. The highest number of fires - 57 took place in 2011, and the least - 5 in 2004. The data has a decreasing trend.
 31.8% incidents where reported in the morning and 68.2% in the evening. The most fires (17.5%) took place on Monday, and the least (10.3%) on Tuesday.
 According to the 349 fire incidents from years 2002 - 2018 most fires (13.5%) took place during January, and the least (4.3%) in September.
 Out of all 374 cases reported during the years 2002 - 2018, the most belonged to the categories: Fire (93.3%), Rescue & EMS (3.7%), and Hazardous Condition (0.8%).
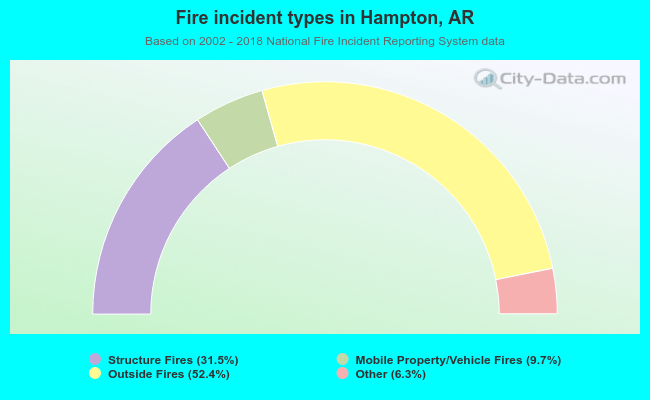 When looking into fire subcategories, the most incidents belonged to: Outside Fires (52.4%), and Structure Fires (31.5%).